Back to www.cobrasmarketview.com

12/05/2015 Weekend Update

User avatar
Cobra
Site Admin
Posts: 58855
Joined: Sat Feb 12, 2011 10:29 pm

12/05/2015 Weekend Update

Post by Cobra »

Institutional buying and selling chart from stocktiming shows more distribution than accumulation and distribution is up while accumulation is down so it's topping phase. By the way, I don't think Friday's huge up would change the accumulation a lot because the breadth was unbelievably poor.
  • When accumulation and distribution are down means we're in trending phase.
  • When accumulation is up, distribution is down, it's a bottoming phase.
  • When accumulation is down, distribution is up, it's the topping phase.
Attachments
inst b sell.png
inst b sell.png (17.8 KiB) Viewed 10466 times

Like to read more of my commentaries? Please subscribe my Daily Market Report.
Subscribers can find all the members only posts HERE.
StockCharts members, please vote for me HERE, thanks.
User avatar
Cobra
Site Admin
Posts: 58855
Joined: Sat Feb 12, 2011 10:29 pm

Re: 12/05/2015 Weekend Update

Post by Cobra »

Smart money no huge buying so according to the case 2.) the pullback isn't over?


How I use the chart:

I don't care what's the logic behind the chart. I found it works in the following two cases:

1.) When market up huge, if I see smart money huge short, best if new record short, then I know a short-term pullback is due soon.
2.) When market down, if I see smart money suddenly rises sharply from very negative value, then I know the pullback was over.

So I only use this chart for the above 2 cases. Besides those 2 cases, it means nothing to me. i.e. the absolute value of this chart means nothing to me, I only care if it rises sharply or drops sharply.
Attachments
NASDAQ_100_Combo_Hedgers_Position.png

Like to read more of my commentaries? Please subscribe my Daily Market Report.
Subscribers can find all the members only posts HERE.
StockCharts members, please vote for me HERE, thanks.
User avatar
Cobra
Site Admin
Posts: 58855
Joined: Sat Feb 12, 2011 10:29 pm

Re: 12/05/2015 Weekend Update

Post by Cobra »

Still only 37% NYSE stocks are above MA200, despite SPX is near all time high.
viewtopic.php?f=10&t=1877&p=208356#p208356

Like to read more of my commentaries? Please subscribe my Daily Market Report.
Subscribers can find all the members only posts HERE.
StockCharts members, please vote for me HERE, thanks.
User avatar
MrMiyagi
Posts: 10328
Joined: Sun Oct 16, 2011 12:48 pm

qqq update

Post by MrMiyagi »

qqq
qqq
User avatar
MrMiyagi
Posts: 10328
Joined: Sun Oct 16, 2011 12:48 pm

Post by MrMiyagi »

SPY $209.62 hit, and today $205.52 pBar price has 25 targets, more than doubling the January 6th multiple targets of 12.
marcueus
Posts: 129
Joined: Sat Nov 29, 2014 5:27 pm

Re:

Post by marcueus »

MrMiyagi wrote:SPY $209.62 hit, and today $205.52 pBar price has 25 targets, more than doubling the January 6th multiple targets of 12.
MrMiyagi what is the lowest Pbar on SP500 not yet fullfilled ? ;)
User avatar
DellGriffith
Posts: 1803
Joined: Sun Aug 25, 2013 5:24 pm

Re: 12/05/2015 Weekend Update

Post by DellGriffith »

daily SPY:

Its really messy now. What was dec 3rd supposed to be? Wave C down in one day? It must be considered since we got a huge white bar that retraced all of it and then some. I don't like this action. I'm not reopening any swing longs or shorts here unless I see something more definitive.

(My mad money daily trades are not a part of this).
bearish as of SPY 406 on 2/17/23
currently: end bearish as of SPY 406 on 3/6/23
User avatar
TraderJoe
Posts: 881
Joined: Mon Apr 02, 2012 7:08 am
Location: USA

Re: 12/05/2015 Weekend Update

Post by TraderJoe »

DellGriffith wrote:daily SPY:

Its really messy now. What was dec 3rd supposed to be? Wave C down in one day? It must be considered since we got a huge white bar that retraced all of it and then some. I don't like this action. I'm not reopening any swing longs or shorts here unless I see something more definitive.

(My mad money daily trades are not a part of this).

I believe you are WAY off on your count. We are not close to C, I'm sure you will know it when C hits. More like a 2000 point drop. :D
fehro
Posts: 22880
Joined: Fri Sep 02, 2011 2:06 pm

Re: 12/05/2015 Weekend Update

Post by fehro »

Weeklies, Dailies candles.. Weeklies a tad suspicious.. RUT/NYSE/DJ-20 - Transports.. all red and weak + DXY - USdollar hence GLD strong.
Attachments
Dailies
Dailies
Weekly
Weekly
fehro
Posts: 22880
Joined: Fri Sep 02, 2011 2:06 pm

Re: 12/05/2015 Weekend Update

Post by fehro »

INDUSTRY groups % weeklies. SPY volume heavy on Friday.
Attachments
Screen Shot 2015-12-05 at 8.58.58 AM.png
fehro
Posts: 22880
Joined: Fri Sep 02, 2011 2:06 pm

Re: 12/05/2015 Weekend Update

Post by fehro »

Worden T2 Indicators http://www.worden.com/TeleChartHelp/Con ... rs_T2s.htm

Several indicators mid week slipped to the sell side.. trying to bounce but weak so far. % stocks >40d>200d 43% / 33%.
As per Cobra's comment, internals not pretty on Friday.. Hi/Lows ratio weak.
Attachments
Screen Shot 2015-12-05 at 9.21.44 AM.png
fehro
Posts: 22880
Joined: Fri Sep 02, 2011 2:06 pm

Re: 12/05/2015 Weekend Update

Post by fehro »

T2 Channels % Stocks 1+2 Channels ><200d Weekly ><40d Daily.
Attachments
Screen Shot 2015-12-05 at 9.24.27 AM.png
fehro
Posts: 22880
Joined: Fri Sep 02, 2011 2:06 pm

Re: 12/05/2015 Weekend Update

Post by fehro »

Yields - active this week
Attachments
Screen Shot 2015-12-05 at 9.30.42 AM.png
fehro
Posts: 22880
Joined: Fri Sep 02, 2011 2:06 pm

Re: 12/05/2015 Weekend Update

Post by fehro »

Yields v2 - tradingview has an issue with "area" plots.. so sorry the red IRX 13 Wk Treasury is a little intense on the graph.. but moving to multi year highs.
Attachments
Screen Shot 2015-12-05 at 9.35.26 AM.png
User avatar
BullBear52x
Posts: 29695
Joined: Tue Feb 22, 2011 3:47 pm

Re: 12/05/2015 Weekend Update

Post by BullBear52x »

Overall weekly candles are pointing to hanging man. (Doji)
1.PNG
short term SPY, bulls show of force did gain a lot of ground Friday since my mid term is still on sell, this push will fail, IMHO.
3.PNG
My comments are for entertainment/educational purpose only. NOT a trade advice.
User avatar
MrMiyagi
Posts: 10328
Joined: Sun Oct 16, 2011 12:48 pm

Post by MrMiyagi »

marcueus wrote:MrMiyagi what is the lowest Pbar on SP500 not yet fullfilled ? ;)
$205.52, of the ones that are within 10 days.
Coldcold
Posts: 6
Joined: Thu Aug 14, 2014 6:03 pm

Re: 12/05/2015 Weekend Update

Post by Coldcold »

Will this do something to the market?

Exclusive: ECB lowered stimulus ambitions after hitting opposition - sources
http://finance.yahoo.com/news/exclusive ... 27867.html
AndrasGy
Posts: 17
Joined: Fri Oct 23, 2015 8:15 pm

Re: 12/05/2015 Weekend Update

Post by AndrasGy »

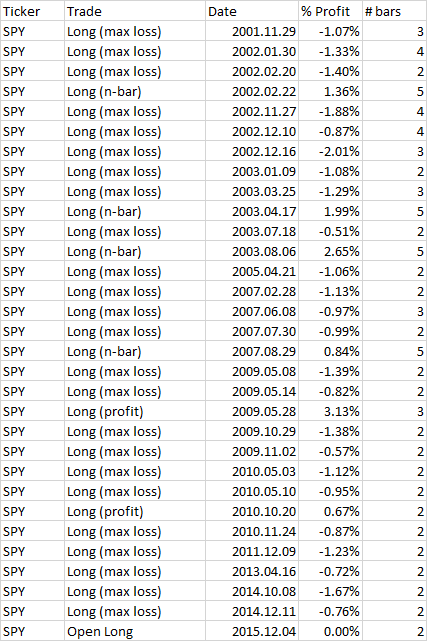
Friday :

Yesterday close down more than -1.3%, today close up more than +1.3%, close > open, close > highest close*0.93:
buy on close, max loss today open, profit target previous high
Image
User avatar
Al_Dente
Posts: 28535
Joined: Thu Jul 21, 2011 2:29 pm

Re: 12/05/2015 Weekend Update

Post by Al_Dente »

Crude Oil, oil stocks, and JUICE
Percent change YTD
This answers the question nobody asked: Which oil ETFs are “better” YTD?
[I haven’t even included DIG/DUG because volume shows that traders are not there].
126oil.png.png
“Crude Oil down 62%, Rig Counts down 66%, Yet Production And Stocks Near All-Time Highs”
[He must be using a different measure than our XLE, which is down 16.55% on the year, but oil stocks, while not “near” ATH are indeed holding up better than crude], and inventory near all-time highs:
http://www.hedgopia.com/crude-oil-%E2%8 ... ime-highs/

vote: https://stockcharts.com/public/1684859

and here's the same chart EXCEPT IT'S THREE MONTHS %:
126oil three mo.png
Disclaimer: I am not an investment advisor. This is just my opinion NOT investment advice.
User avatar
gappy
Posts: 3163
Joined: Tue Nov 22, 2011 3:34 pm
Location: Peapatch Tx

Re: 12/05/2015 Weekend Update

Post by gappy »

Rating Action: Moody's changes outlook to stable on 9 Russian sub-sovereigns; ratings affirmed
Global Credit Research - 04 Dec 2015 (This news was sold) daily:
rusl.PNG
Moody pop reasoning:
Capture.PNG
...and Moody showing it's puppet strings:
aa.PNG
So maybe a rusl pop, and this is positive for a Dow tit for tat ramp, along with reinforcement for tonights tv message by another puppet. Vote Cobra. glta
‘the petrodollar is our currency and our problem’....Gappy
Post Reply