Back to www.cobrasmarketview.com

12/12/2015 Weekend Update

User avatar
Cobra
Site Admin
Posts: 58855
Joined: Sat Feb 12, 2011 10:29 pm

12/12/2015 Weekend Update

Post by Cobra »

Institutional buying and selling chart from stocktiming shows more distribution than accumulation. Distribution is up while accumulation is down so it's topping phase.
  • When accumulation and distribution are down means we're in trending phase.
  • When accumulation is up, distribution is down, it's a bottoming phase.
  • When accumulation is down, distribution is up, it's the topping phase.
Attachments
inst b sell.png
inst b sell.png (17.04 KiB) Viewed 4955 times

Like to read more of my commentaries? Please subscribe my Daily Market Report.
Subscribers can find all the members only posts HERE.
StockCharts members, please vote for me HERE, thanks.
User avatar
Cobra
Site Admin
Posts: 58855
Joined: Sat Feb 12, 2011 10:29 pm

Re: 12/12/2015 Weekend Update

Post by Cobra »

Smart money no huge buying so according to the case 2.) the pullback isn't over?


How I use the chart:

I don't care what's the logic behind the chart. I found it works in the following two cases:

1.) When market up huge, if I see smart money huge short, best if new record short, then I know a short-term pullback is due soon.
2.) When market down, if I see smart money suddenly rises sharply from very negative value, then I know the pullback was over.

So I only use this chart for the above 2 cases. Besides those 2 cases, it means nothing to me. i.e. the absolute value of this chart means nothing to me, I only care if it rises sharply or drops sharply.
Attachments
NASDAQ_100_Combo_Hedgers_Position.png

Like to read more of my commentaries? Please subscribe my Daily Market Report.
Subscribers can find all the members only posts HERE.
StockCharts members, please vote for me HERE, thanks.
User avatar
Al_Dente
Posts: 28535
Joined: Thu Jul 21, 2011 2:29 pm

Re: 12/12/2015 Weekend Update

Post by Al_Dente »

Technically, the gap between 2 oct and 5 oct is the next support, and the 200ma is now resistance.
We can probably all agree that at the very least, the minimum requirement for a sustainable bull is that SPY and most/all of her constituents are above their 200ma.
Check your own charts: throughout 2008, SPY stayed below her 200ma, roughly, for the entire crash year.
So, now who’s above 200: well, this week it was OEX and QQQ and XLY, with SPY teetering above and below her 200ma.
Friday we lost SPY and OEX leaving only QQQ and XLY above their 200.
[$COMPQ, the full nasdaq, not on this chart, just went below 200]
So: QQQ and XLY: is that enough?
No.
1211ma 200.png
Longer term: note that coming off every low since the 2009 bottom, the RSP (equal-weighted spy) recovered, and rather quickly.
Conclusion: The RSP MUST RECOVER, and soon. In fact, most/all of these “aggressives” MUST RECOVER for a healthy bull to continue.

Vote: https://stockcharts.com/public/1684859
1211ma 200b.png
Disclaimer: I am not an investment advisor. This is just my opinion NOT investment advice.
User avatar
Al_Dente
Posts: 28535
Joined: Thu Jul 21, 2011 2:29 pm

Re: 12/12/2015 Weekend Update

Post by Al_Dente »

WEEKLY Elder bars here all went red this week.
Hypothesis: there is never just one cockroach, and never just one weekly red Elder bar.
The reality is quite the contrary: examples where there were solo red weekly Elders are PLENTIFUL.
2 years, weekly, ignore vertical lines
1211week elder.png.png
Disclaimer: I am not an investment advisor. This is just my opinion NOT investment advice.
User avatar
Al_Dente
Posts: 28535
Joined: Thu Jul 21, 2011 2:29 pm

Re: 12/12/2015 Weekend Update

Post by Al_Dente »

JUNK BONDS, HYG, “Exhaustion Volume”
Average daily volume is 9.48 million shares
Friday’s volume was 54.2 million shares
The “perfect” classic bottom would be another price low on reduced selling volume. But things are rarely perfect…
This is the most volume seen YTD. In fact, Friday was the highest volume day in the life of the fund (it was born in 2007).
The same is true of JNK, its competitor.
1212hyg.png.png
Disclaimer: I am not an investment advisor. This is just my opinion NOT investment advice.
jademann
Posts: 1032
Joined: Wed Aug 22, 2012 10:49 am

Re: 12/12/2015 Weekend Update

Post by jademann »

Getting ready to sell ALL US assets - and go short, if it even looks like a demagogue might win.
My comments were dictated to me by homie the clown
Trades with cats
Posts: 8656
Joined: Sat Oct 11, 2014 4:40 pm

Re: 12/12/2015 Weekend Update

Post by Trades with cats »

jademan,

It is early in the election cycle. No one is paying attention and most who were leading at this point were out six months later. :lol:
nikman
Posts: 185
Joined: Tue Feb 15, 2011 1:20 am

Re: 12/12/2015 Weekend Update

Post by nikman »

I never care too much about who wins, but this time I am definitely voting to make sure I do my bit to help anyone but the demagogue win.

Sent from my SM-G920T using Tapatalk
Trades with cats
Posts: 8656
Joined: Sat Oct 11, 2014 4:40 pm

Re: 12/12/2015 Weekend Update

Post by Trades with cats »

Worthless article at Zerohedge on Stone Lion the junk debt Hedge Fund that sealed exits Friday afternoon. The only nugget was that the founders were Bear Stearns junk bond fund executives. A second article from David Stockman about Richard Kinder's latest Ponzi to blow up. He was an ENRON executive who with his partner managed to buy ENRON pipeline out of the wreckage for 40 million. Grew it to a billion dollar company by promising retires growth, high dividends and no taxes. He delivered misstated financials and unlimited debt using his ENRON skills.

AS Pata Bosses chart on HYG shows Ma and Pa Kettle started to get the message on Friday. The questions to me are how many more of these "incidents" are we going to have, especially with the Fed determined to reverse the liquidity flows, keeping in mind that these high yield bonds have almost no liquidity already. Add to that tax loss selling season and it looks like it could get ugly. I have passed on too may times already that without fresh junk bond issues the shale drillers will literally run out of operating money. Also I havn't seen a number in print but lots of experts claim a very significant amount of the markets buyback cash comes from new debt and a lot of that is junk bonds and leveraged loans (which become CDO's or something like that).

Its starting to look like Deja Vu all over again (thank-you Yogi Berra)
fehro
Posts: 22880
Joined: Fri Sep 02, 2011 2:06 pm

Re: 12/12/2015 Weekend Update

Post by fehro »

Weekly / Daily Candles. Weeklies not pretty. Seems better support still a tad lower.
Attachments
Dailies
Dailies
Weekly
Weekly
fehro
Posts: 22880
Joined: Fri Sep 02, 2011 2:06 pm

Re: 12/12/2015 Weekend Update

Post by fehro »

Industry Group % Weeklies. SPY heavy vol Friday again. Very little green industry index wise for the week
Attachments
Screen Shot 2015-12-12 at 1.46.43 PM.png
fehro
Posts: 22880
Joined: Fri Sep 02, 2011 2:06 pm

Re: 12/12/2015 Weekend Update

Post by fehro »

Worden T2 Indicators http://www.worden.com/TeleChartHelp/Con ... rs_T2s.htm
As per last weekend, indicators push deeper to the sell side. SKEW at tad un-nerving… + 146.53! http://www.cboe.com/micro/skew/documents/SKEWFAQ.pdf
Attachments
Screen Shot 2015-12-12 at 1.47.30 PM.png
fehro
Posts: 22880
Joined: Fri Sep 02, 2011 2:06 pm

Re: 12/12/2015 Weekend Update

Post by fehro »

T2 Channels % Stocks 1+2 Channels ><200d Weekly ><40d Daily. Amazing the shift in 5 trading days.
Attachments
Screen Shot 2015-12-12 at 1.48.13 PM.png
fehro
Posts: 22880
Joined: Fri Sep 02, 2011 2:06 pm

Re: 12/12/2015 Weekend Update

Post by fehro »

Yields
Attachments
Screen Shot 2015-12-12 at 2.02.07 PM.png
fehro
Posts: 22880
Joined: Fri Sep 02, 2011 2:06 pm

Re: 12/12/2015 Weekend Update

Post by fehro »

Yields v2 *IRX 13w Treasury- pushing into 2009 highs
Attachments
Screen Shot 2015-12-12 at 2.07.08 PM.png
Last edited by fehro on Sat Dec 12, 2015 6:47 pm, edited 2 times in total.
fehro
Posts: 22880
Joined: Fri Sep 02, 2011 2:06 pm

Re: 12/12/2015 Weekend Update

Post by fehro »

ZB1!/SPX - T-Bond W/D
ZN1!/SPX - 10yr T-note W/D
Attachments
Bond/SPX
Bond/SPX
10yr/SPX
10yr/SPX
User avatar
BullBear52x
Posts: 29695
Joined: Tue Feb 22, 2011 3:47 pm

Re: 12/12/2015 Weekend Update

Post by BullBear52x »

Oversold yes,
1.PNG
Reversal No,
3.PNG
My comments are for entertainment/educational purpose only. NOT a trade advice.
tsf
Posts: 538
Joined: Tue Feb 15, 2011 7:49 am

Re: 12/12/2015 Weekend Update

Post by tsf »

According to e-Zstock7 (posted on Dec 12 over at the Slope) :
per Reuters, a company couldn't pay its debt on friday Dec 11, that was cited as one reason for the dow being down 300
tsf
Posts: 538
Joined: Tue Feb 15, 2011 7:49 am

Re: 12/12/2015 Weekend Update

Post by tsf »

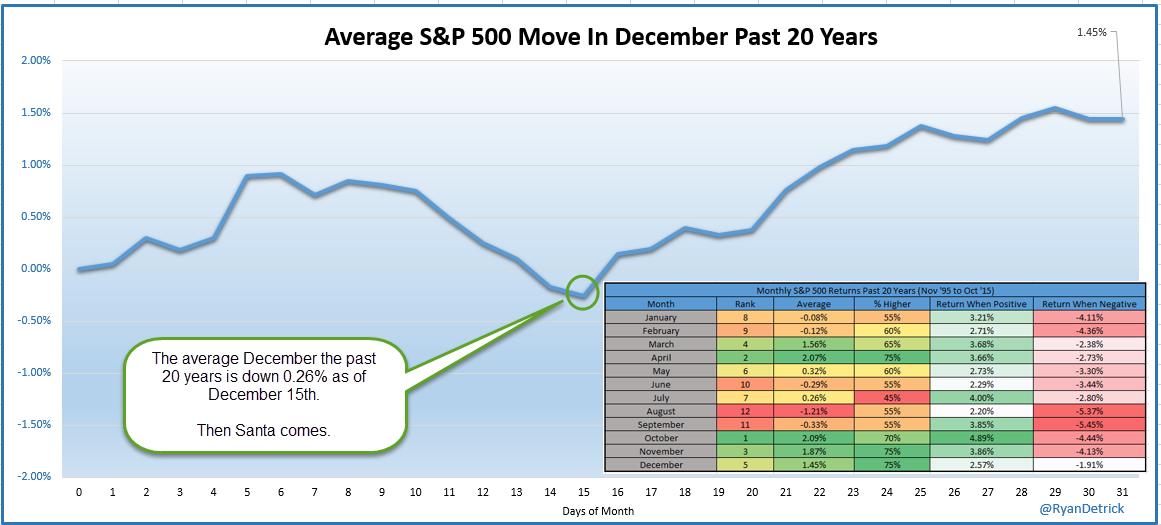
Ryan Detrick, CMT ‏@RyanDetrick Dec 10
The average $SPX in December the past 20 years is actually down as of Dec 15th. Then Santa comes to town
Image
AndrasGy
Posts: 17
Joined: Fri Oct 23, 2015 8:15 pm

Re: 12/12/2015 Weekend Update

Post by AndrasGy »

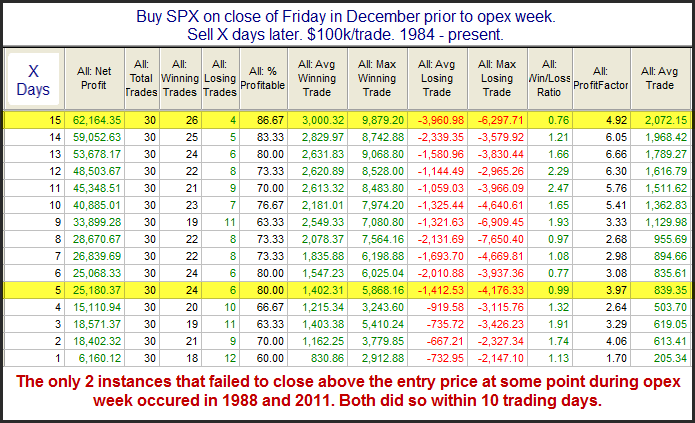
Next week we enter a quite bullish period, current setup seems almost perfect to buy :
Image

NYMO below 80:
Image

December seasonality:
Image

December opes and behind:
Image
Post Reply