Institutional buying and selling chart from stocktiming shows more distribution than accumulation, so the trend resumes down again.
Attachments
1.png (17.55 KiB) Viewed 9694 times
Like to read more of my commentaries? Please subscribe my Daily Market Report. Subscribers can find all the members only posts HERE. StockCharts members, please vote for me HERE, thanks.
Smart money huge short, so it's case 1 below, not good for bulls.
Since there're some arguments about how to read the chart, so it's necessary for me to explain here how I use this chart:
I don't care what's the logic behind the chart. I found it works in the following two cases:
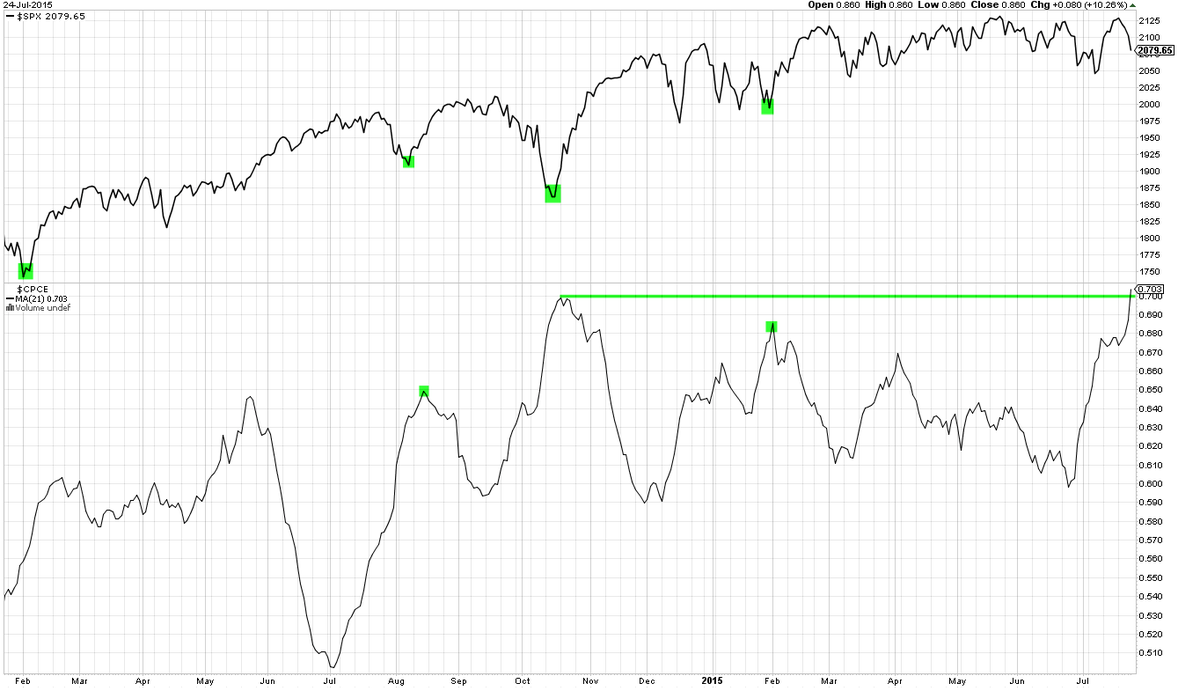
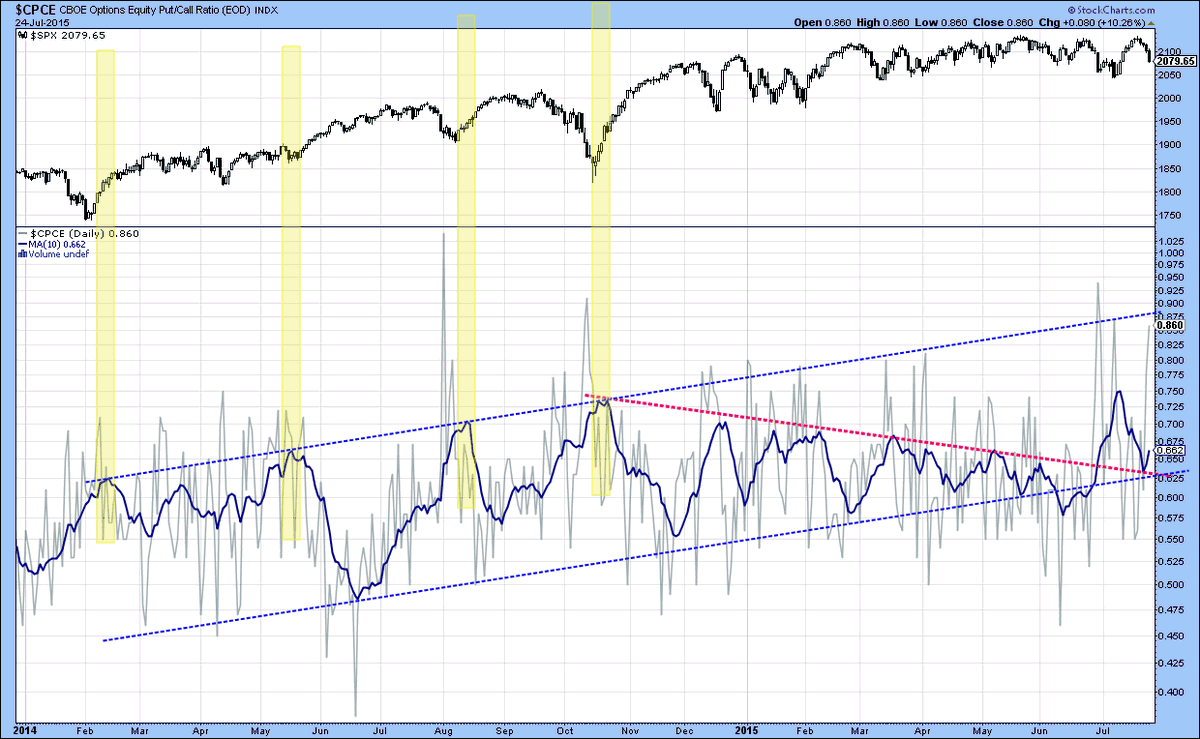
1.) When market up huge, if I see smart money huge short, best if new record short, then I know a short-term pullback is due soon.
2.) When market down, if I see smart money suddenly rises from very negative value, then I know the pullback was over.
So I only use this chart for the above 2 cases. Besides those 2 cases, it means nothing to me. i.e. the absolute value of this chart means nothing to me, I only care if it rises sharply or drops sharply.
Attachments
Like to read more of my commentaries? Please subscribe my Daily Market Report. Subscribers can find all the members only posts HERE. StockCharts members, please vote for me HERE, thanks.
Like to read more of my commentaries? Please subscribe my Daily Market Report. Subscribers can find all the members only posts HERE. StockCharts members, please vote for me HERE, thanks.
Like to read more of my commentaries? Please subscribe my Daily Market Report. Subscribers can find all the members only posts HERE. StockCharts members, please vote for me HERE, thanks.
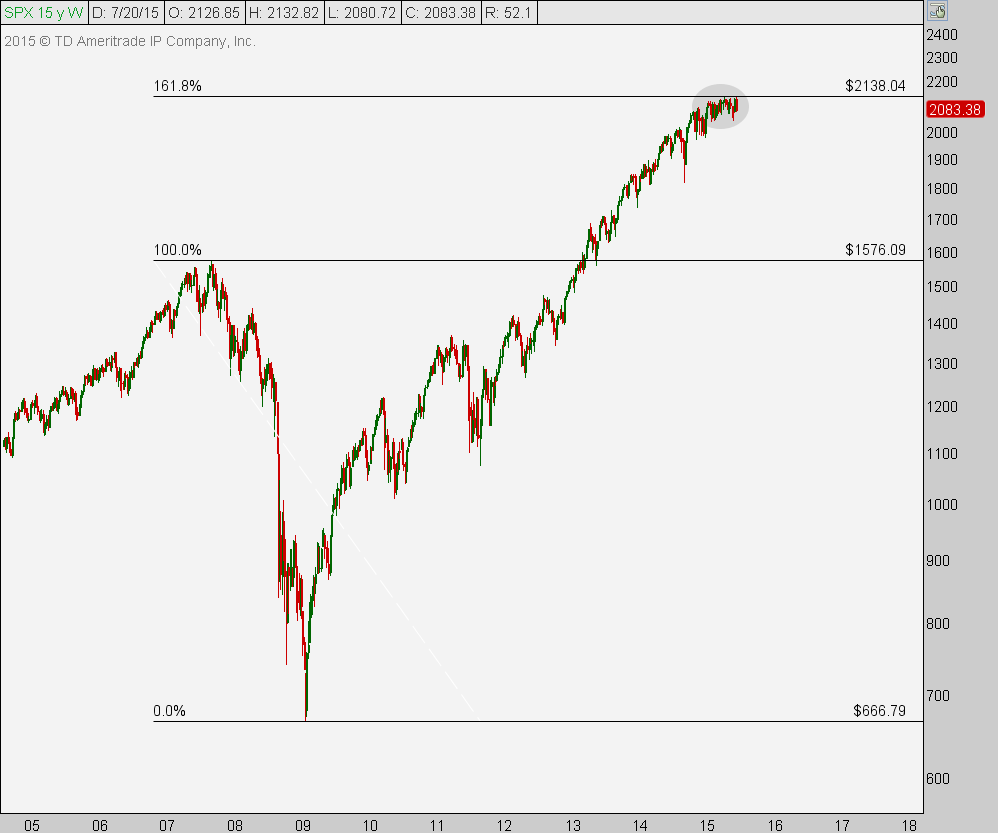
last weekend I posted we would get a doji and roll-over - which has happened and we are half-way down the slide.
This video is on a longer-term view. http://screencast.com/t/K5BunTWUG
Attachments
Educational only and not trading advice (EO&NTA) Good trading to all