Zane wrote:wouldn't it be a really bearish sign if the Pbar shows massive sells at the highs?
Yes, it is VERY bearish!
As to your other question: “… then how come it will be hit later ? I don't get the correlation here.”
In theory, “Big Payer #1” would sell at the top to a market maker or another party with deep pockets (call this party: “Big Payer #2”). Now, “Big Payer #2” is not exactly thrilled to be holding the bag, but has money and staying power to hold on until the market moves back in their direction. In fact if it is the “right” party that is left holding the bag, they actually “help” the market move back towards their position. This is why the market frequently (but not always) hits these p-bars within a reasonable amount of time.
Of course that is just my educated guess. As always, I could be wrong.
so to analyze this Pbar, if it is below the price, it can be considered as bullish; but if it is above the price, then it is bearish.....well, i just hope this 210 will get hit.....doubted it will......
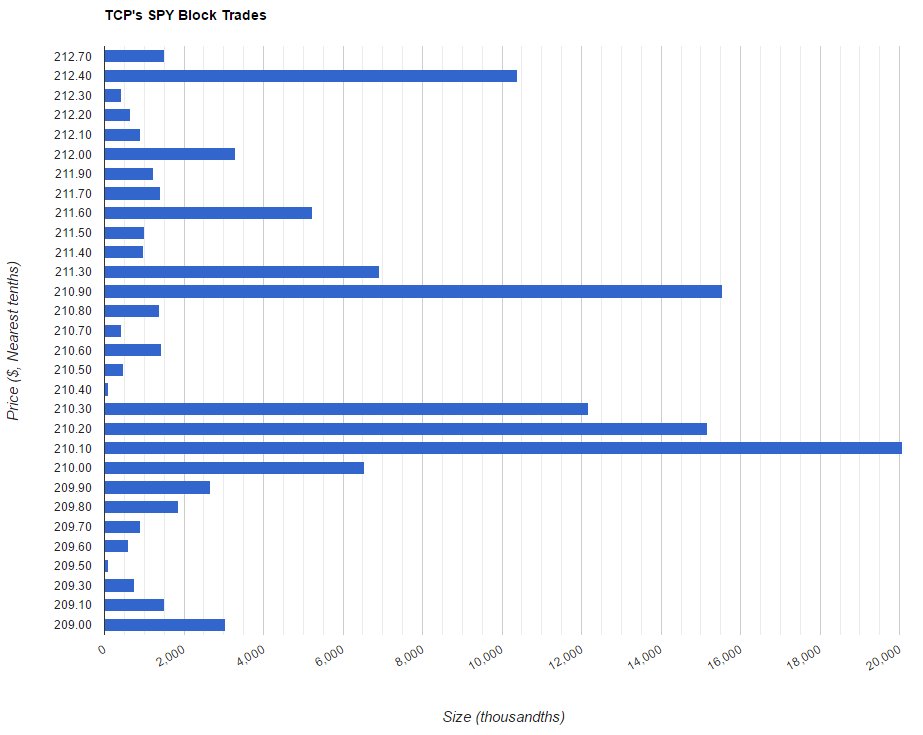
The $210.85 dark pool/p-bars could represent long stock that was unloaded or shares that were sold short. There really is no way of knowing when or at what price that they would either enter long again or cover their short sale.
Nonetheless, the market could recover within days, weeks or take months to do so.
All that is certain is that someone made a very large bearish bet that the market was going to move down after the BREXIT vote. It did, and they were right. If the entity on the other side of the trade was a market maker, then they were well hedged.
Sometime in the future the market will move up and we will begin to see dark pool prints and p-bars below that days price, but still in the price range of the prior days action. That will be bullish.
MrMiyagi looks at the p-bars differently. A high percentage of the ones that he tracks are hit within ten (10) days. Therefore, if I understand his methodology correctly, he looks at p-bars above price as a bullish and the ones below the price as bearish.
It also seems to work … so who really knows?
I hope this helps. Trade safe!
Good discussion. It doesn't explain how there were a few p-bars all the way up at ~221 SPY, a level that has never been hit in the past. I guess I side with Miyagi, they are somehow possibly being used targets for the big boys.
Zane wrote:wouldn't it be a really bearish sign if the Pbar shows massive sells at the highs?
Yes, it is VERY bearish!
As to your other question: “… then how come it will be hit later ? I don't get the correlation here.”
In theory, “Big Payer #1” would sell at the top to a market maker or another party with deep pockets (call this party: “Big Payer #2”). Now, “Big Payer #2” is not exactly thrilled to be holding the bag, but has money and staying power to hold on until the market moves back in their direction. In fact if it is the “right” party that is left holding the bag, they actually “help” the market move back towards their position. This is why the market frequently (but not always) hits these p-bars within a reasonable amount of time.
Of course that is just my educated guess. As always, I could be wrong.
so to analyze this Pbar, if it is below the price, it can be considered as bullish; but if it is above the price, then it is bearish.....well, i just hope this 210 will get hit.....doubted it will......
The $210.85 dark pool/p-bars could represent long stock that was unloaded or shares that were sold short. There really is no way of knowing when or at what price that they would either enter long again or cover their short sale.
Nonetheless, the market could recover within days, weeks or take months to do so.
All that is certain is that someone made a very large bearish bet that the market was going to move down after the BREXIT vote. It did, and they were right. If the entity on the other side of the trade was a market maker, then they were well hedged.
Sometime in the future the market will move up and we will begin to see dark pool prints and p-bars below that days price, but still in the price range of the prior days action. That will be bullish.
MrMiyagi looks at the p-bars differently. A high percentage of the ones that he tracks are hit within ten (10) days. Therefore, if I understand his methodology correctly, he looks at p-bars above price as a bullish and the ones below the price as bearish.
It also seems to work … so who really knows?
I hope this helps. Trade safe!
Good discussion. It doesn't explain how there were a few p-bars all the way up at ~221 SPY, a level that has never been hit in the past. I guess I side with Miyagi, they are somehow possibly being used targets for the big boys.
The good news for anyone trapped long is that the anticipated “summer rally” should provide an opportunity to adjust your portfolio.
The $210.85 SPY p-bars may well be reached within the next three weeks …
“The summer rally period for stocks is directly around the corner, spanning a three week period that begins around the end of June and running into mid-July.”
From time to time, some people on Twitter and Stockwits share their clever charts tracking both prices and volumes for Block Trades.
Their charts and interpretations often added value. But their works could not save them from a wrong guess prior to Brexit referendum,