Cobra - if SPY closed above its August 17 high of 121 and change, would that suggest a "rising wedge" you illustrated on the 26th? Would it also suggest a few more days of this rebound?
Last edited by Mongoose on Mon Aug 29, 2011 2:39 pm, edited 1 time in total.
Mongoose wrote:Cobra - if SPY closed above its August 17 high of 121 and change, would that suggest a "rising wedge" you illustrated on the 26th? Would it also suggest a few more days of this rebound?
more rebound if close right here, and it's still could be Rising Wedge case unless we're up huge from here with no real pullback.
Like to read more of my commentaries? Please subscribe my Daily Market Report. Subscribers can find all the members only posts HERE. StockCharts members, please vote for me HERE, thanks.
first of all, the first Measured Move target (ZigZag) has been reached. I see a small Rising Wedge here but need see more, because it's very difficult to time when the wedge will breakdown.
Attachments
Like to read more of my commentaries? Please subscribe my Daily Market Report. Subscribers can find all the members only posts HERE. StockCharts members, please vote for me HERE, thanks.
KENA wrote:IMHO..I don't see the mkt going up much from here..Some of the leaders have topped out and are having Lots of Res. on the dn trend line.None have broken it yet.These are..VMW,LULU,CMG,BIDU,NFLX..N ow we wait and see.
Yup. I agree. Im short CMG , NFLX and GOOG (max pain is 545). all positions entered today.
AAPL is not moving either....which is a red flag to me even though im long and have a target of 397...im thinking of leaving 1 oct call on as a hedge for my shorts!
But I would love to see the maket caught with its PANTSSSSS DOWNNN!!!
I am sorry to disagree, but this sure sounds like a suicide tactic this early...
bears make money, bulls make money, but pigs get slaughtered
Cobra - I have noticed too, 1206 is the Fibonnaci retracement level of 38.2% (between the high in July and the recent low). This is the 2nd attempt by the market. Is there any technical interpretation to this?
Last edited by Mongoose on Mon Aug 29, 2011 2:50 pm, edited 1 time in total.
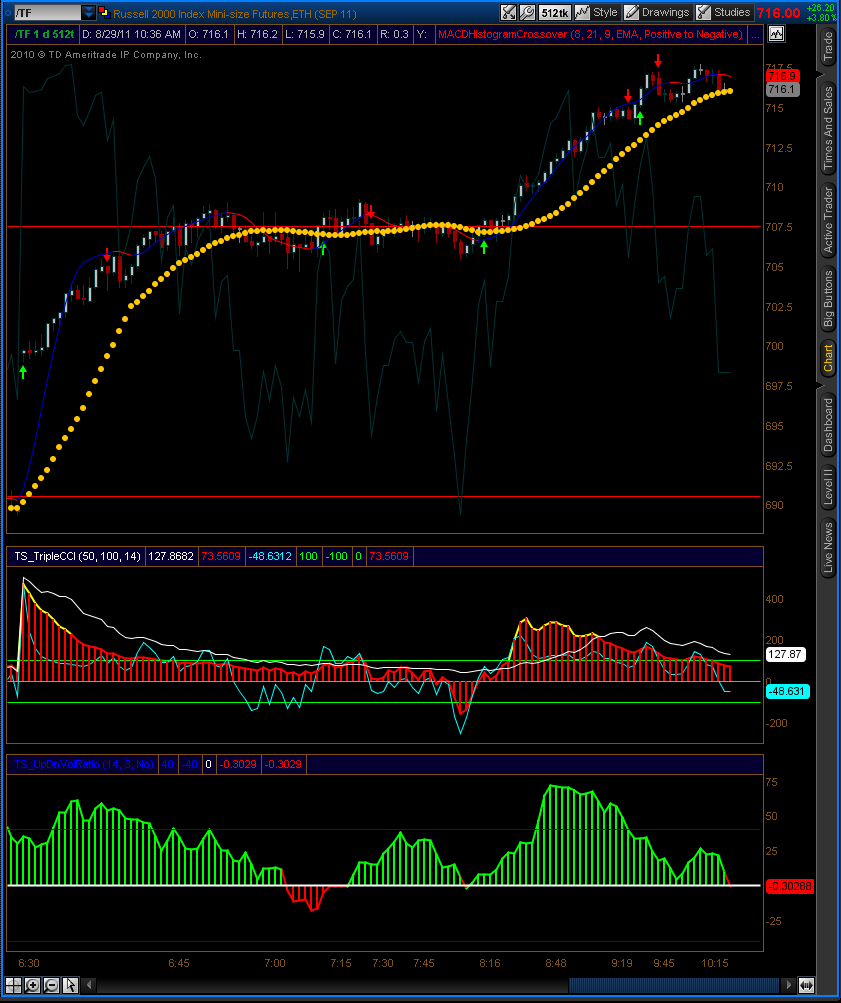
just curious. which indicator on your price chart is generating those red and green arrows? Also what is that wide dots? Is that a moving average?
Thanks
ddd wrote:2nd pivoting time of the day for /TF. Out of longs for intraday trade for now and watch if a correction materialize at this point.
The built-in MACDHIstogramCrossover(8,21,9,EMA) as shown in the header. Only as references, I don't trade based on those signals along, as they cause trouble during consolidation / sideways.
Mongoose wrote:Cobra - I have noticed too, 1206 is the Fibonnaci retracement level of 38.2% (between the high in July and the recent low). This is the 2nd attempt by the market. Is there any technical interpretation to this?
If pullback from this level then it's resistance otherwise it's nothing, so not much implication.
Like to read more of my commentaries? Please subscribe my Daily Market Report. Subscribers can find all the members only posts HERE. StockCharts members, please vote for me HERE, thanks.
If you don't mind, can you share your entry/exit strategy in intraday /TF?
Thanks in advance,
varaamo
ddd wrote:
varaamo wrote:ddd,
just curious. which indicator on your price chart is generating those red and green arrows? Also what is that wide dots? Is that a moving average?
Thanks
ddd wrote:2nd pivoting time of the day for /TF. Out of longs for intraday trade for now and watch if a correction materialize at this point.
The built-in MACDHIstogramCrossover(8,21,9,EMA) as shown in the header. Only as references, I don't trade based on those signals along, as they cause trouble during consolidation / sideways.


(don't copy, this is high risk!)