Back to www.cobrasmarketview.com |

they are different in the time frame model.uempel wrote:Funny, all of our comments are quite dubious
Or does some reader know

Yes, agreed and thank you for your charts (everyone here too) I use RSI (5) on my weekly, we are getting a bounce there at 50 line as expected, but what's not there is MACD hist. bar is still lower than last week's bar, from that view I think we need a solid rebound chart pattern before initiate any long position. well, WDIK?KeiZai wrote:Thanks BB btw look at weekly candles too early to be hyper bearishBullBear52x wrote:Hello Weekenders.
Bears can not cerebrate quite yet, it's true all roads lead to Rome, but right now we are still at the beach in Rittamy fun on curve3rd time is a charm?Dead cat bonce is at hand or gap down to new trading range.
After 3 years of brainwash, bears are jittery.uempel wrote:Cobra, my guess: a sentiment poll this weekend would show strong bearish sentiment - most of us are bearish, me too. Why? My favorite medium term indicators are showing weakness. But I feel uncomfortable with short positons just too much bearishness around me.
These two charts suggest that bears still have to prove they are in charge..BPNYA still looks very bullish, BPSPX (not shown) is neutral, and short term SPX does not yet favor the bears, unless we read the three bumps as a H&S
uempel wrote:KeiZai, did you ever read a biography of Jesse Livermore? Most disastrous life. I guess he had a bipolar disorder. Sad to read.
KeiZai wrote:uempel wrote:KeiZai, did you ever read a biography of Jesse Livermore? Most disastrous life. I guess he had a bipolar disorder. Sad to read.
Nope but I will thanks for mentioning his book, trading is not easy today and in old times it must be even harder mainly on the psyche (I can not even imagine to trade without oscillators, macd and lot of helpful stuff what we have now) there are too many gravestones in this market too bad we can not just click on game over and start again
In your second comment u absolutely nailed it
see u later my friend
HI Uempel..How about the Dow At 12000/12300 by the end of Nov and 11500 by the wnd of Dec.No Joke this could happen if now the next hi is a lower hi then the dn trend begins even though this is an election year..Time will tell so we wait and see how the pieces come together..Ps..Also the lower may have already been put in.uempel wrote:Funny, all of our comments are quite dubious
KENA wrote:HI Uempel..How about the Dow At 12000/12300 by the end of Nov and 11500 by the wnd of Dec.No Joke this could happen if now the next hi is a lower hi then the dn trend begins even though this is an election year..Time will tell so we wait and see how the pieces come together..Ps..Also the lower may have already been put in.uempel wrote:Funny, all of our comments are quite dubious
Harapa wrote:Are we done with the bulls?
Let's check with TRIN;TRIN say not yet.
I would like to see at least two signals from this setup (either trend line breaks or oscillators turning negative). I see none.
(EDIT:correct chart posted) For future reference, trend lines seem to occur earlier than oscillators. These also tend to be early in signalling a change in trend; sometime way two early.

Nice counts & awesome charts KeiZai. Could you elaborate on why you foresee a triple three off the mid-Sept high in $RUT, or is the inlaid waveform on that chart just for the purposes of the first 2/3 of the pattern?KeiZai wrote:Russell
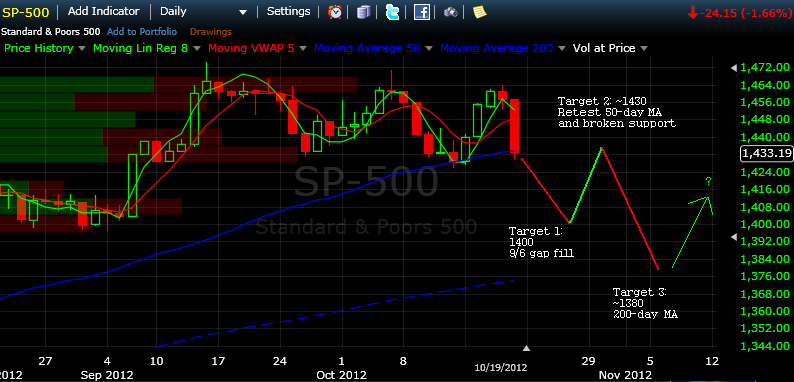
When I first started watching this analog, I was thinking along the lines of your first idea. If the comparison still has any basis, the strong rebound earlier last week might provide reason for agreement with your favorite scenario.uempel wrote:If SPX drops down to 1417/1420 Monday and doesn't recover fast, the market will continue to slide through the green cloud, first target at 1400ish. My favorite scenario is more bullish. A quick dip down to 1420ish and than a strong recovery into the 1440 area
Also consider that this was a failed head test of the H&S target then is 1380ish if its C and A=C target also 1380ish concern now should be at 1420 if it holds we should see 1550 shortlyZimZeb wrote:When I first started watching this analog, I was thinking along the lines of your first idea. If the comparison still has any basis, the strong rebound earlier last week might provide reason for agreement with your favorite scenario.uempel wrote:If SPX drops down to 1417/1420 Monday and doesn't recover fast, the market will continue to slide through the green cloud, first target at 1400ish. My favorite scenario is more bullish. A quick dip down to 1420ish and than a strong recovery into the 1440 area