Back to www.cobrasmarketview.com |
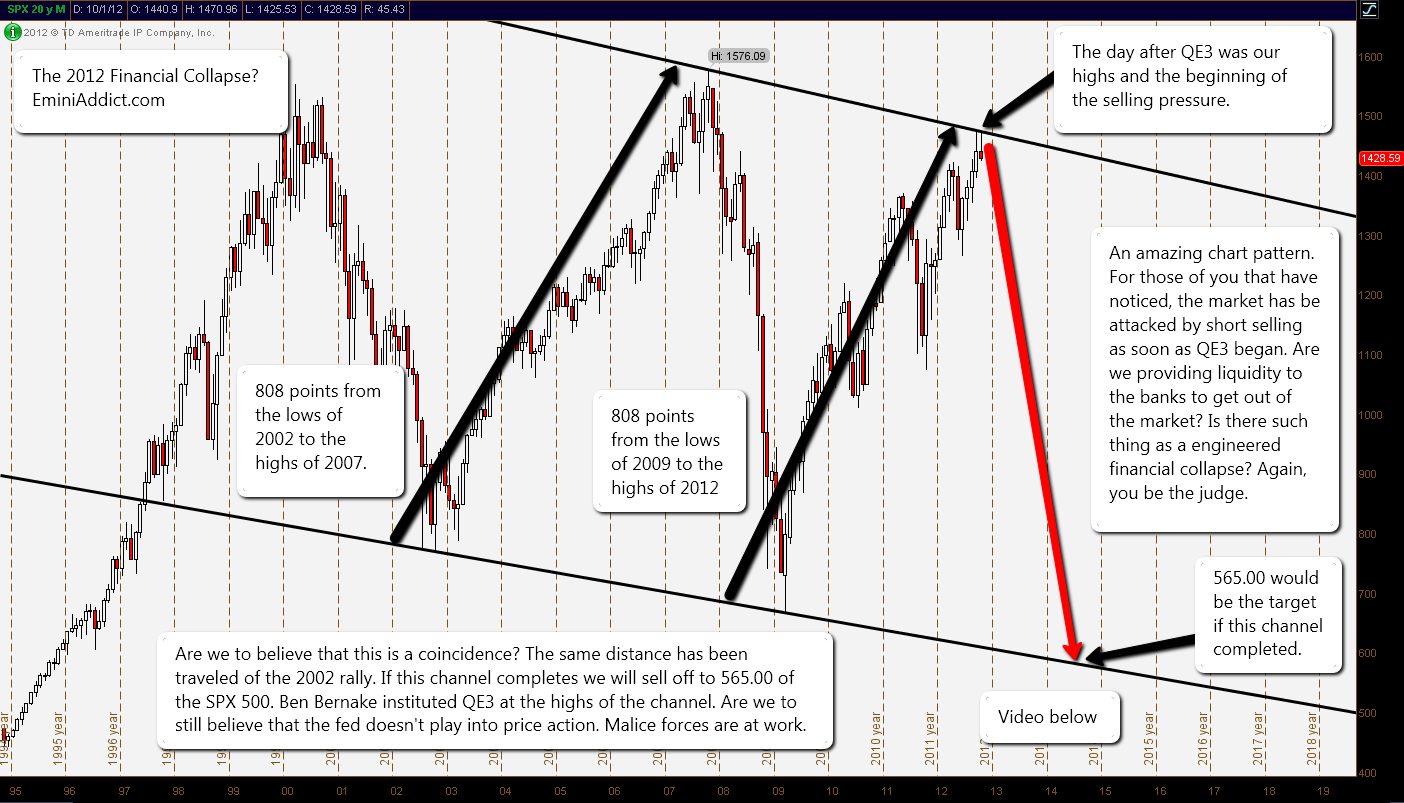
I've noticed this for a while. This drawing is not accurate. The top is around 1488, not the QE3 top. Let's relax and enjoy the climax.Seawaves wrote:David Halsey posted a scary chart, but it's hard to believe
http://eminiaddict.com/wp-content/uploa ... sh_001.png
1576.09 - 768.63 = 807.46knock wrote:This drawing is not accurate. The top is around 1488,

using parallel lines. see the top ceiling white line in the chart!ZimZeb wrote:1576.09 - 768.63 = 807.46knock wrote:This drawing is not accurate. The top is around 1488,
1474.51 - 666.79 = 807.72
Are you getting 1488 by some other method, or is my arithmetic off?
Yes I favor C wave down in risk this week because of dollar, but the tricky thing with C-waves is that they are contratrendish and that´s why they use to fail (truncated c) The key to watch this week is definitely dollar...I have prepared trading plan4both scenariosdaytradingES wrote:Thanks for the Rio chart Keizai!KeiZai wrote:Iron ore and etc traders my short-term take on Rio Tinto (price in pound sterling)
Sorry to be a dim bulb but do you read your chart that it will go down?
I read an article - perhaps at zero hedge? - that the only thing you needed to track the health of the economy of China (and since the world seems to be banking on then correspondingly the health of the world recovery) was the demand for iron and so a chart of the price of iron was all you need!
I love this kind of charts, big thanks...Andrew rulezKaZoom wrote:This LOG scale long-term medianline view of SSEC (Shanghai) suggests a climb to at least next spring.
The wedge should break up and follow the green medianline to at least the blue arrow.
I find it fascinating when a LOG scale fork is so well respected.KeiZai wrote: I love this kind of charts, big thanks...Andrew rulez

LOL Dr. Al, Thanks I never left, I just in different focusAl_Dente wrote:Great charts this weekend THANKS TO ALL
Many charts show support. Some charts are so advanced that understanding them is a supreme challenge
Here is a chart for beginners and intermediates and simple country folks like the dente
GL2all "What are we doing here, that is the question. And we are blessed in this, that we happen to know the answer.
Yes, in the immense confusion one thing alone is clear. We are waiting for Godot to come.” [Samuel Beckett]
Brubeck: http://www.youtube.com/watch?v=vmDDOFXSgAs
ps BB52x soooooooo glad u r back
ps DR X nice 2 see u. how are yr elders??
ps zimzeb thanks
etc etc
Here is my pick of the day FXI, selling Monday will get a 1-2% head start, early bird extreme counter trend. see CCI and BB% ( classic exhaustion volume ) break out line as support, if fail there it will turn out to be a home run. I am eyeing Monday.KaZoom wrote:I find it fascinating when a LOG scale fork is so well respected.KeiZai wrote: I love this kind of charts, big thanks...Andrew rulez
I've also seen LOG fibs turn the trend on long-term charts.
hahaha bb focus this: http://www.youtube.com/watch?v=wKJmuViL ... re=relatedBullBear52x wrote:LOL Dr. Al, Thanks I never left, I just in different focusAl_Dente wrote:Great charts this weekend THANKS TO ALL...blablabla
ps BB52x soooooooo glad u r back...
Hmm...gtgAl_Dente wrote:hahaha bb focus this: http://www.youtube.com/watch?v=wKJmuViL ... re=relatedBullBear52x wrote:LOL Dr. Al, Thanks I never left, I just in different focusAl_Dente wrote:Great charts this weekend THANKS TO ALL...blablabla
ps BB52x soooooooo glad u r back...
Many thanks Clark!ClarkW wrote:
Great stuff, daytradingES!


