Back to www.cobrasmarketview.com

09/10/2016 Weekend Update

User avatar
Cobra
Site Admin
Posts: 58982
Joined: Sat Feb 12, 2011 10:29 pm

09/10/2016 Weekend Update

Post by Cobra »

Smart money suddenly record short while QQQ made new high this week so it's case 1.), a pullback is due (may have already started today).


How I use the chart:

I don't care what's the logic behind the chart. I found it works in the following two cases:

1.) When market up huge, if I see smart money huge short, best if new record short, then I know a short-term pullback is due soon.
2.) When market down, if I see smart money suddenly rises sharply from very negative value, then I know the pullback was over.

So I only use this chart for the above 2 cases. Besides those 2 cases, it means nothing to me. i.e. the absolute value of this chart means nothing to me, I only care if it rises sharply or drops sharply.
Attachments
1.png

Like to read more of my commentaries? Please subscribe my Daily Market Report.
Subscribers can find all the members only posts HERE.
StockCharts members, please vote for me HERE, thanks.
User avatar
Cobra
Site Admin
Posts: 58982
Joined: Sat Feb 12, 2011 10:29 pm

Re: 09/10/2016 Weekend Update

Post by Cobra »

don't forget our weekly sentiment poll here: viewtopic.php?f=9&t=2173

Like to read more of my commentaries? Please subscribe my Daily Market Report.
Subscribers can find all the members only posts HERE.
StockCharts members, please vote for me HERE, thanks.
User avatar
Cobra
Site Admin
Posts: 58982
Joined: Sat Feb 12, 2011 10:29 pm

Re: 09/10/2016 Weekend Update

Post by Cobra »

Summary of the week's stock picks:
viewtopic.php?f=10&t=2168&p=229647#p229647

Like to read more of my commentaries? Please subscribe my Daily Market Report.
Subscribers can find all the members only posts HERE.
StockCharts members, please vote for me HERE, thanks.
tsf
Posts: 539
Joined: Tue Feb 15, 2011 7:49 am

Re: 09/10/2016 Weekend Update

Post by tsf »

http://vixandmore.blogspot.ca/2015/06/t ... pect.html

Bill Luby
MONDAY, JUNE 29, 2015
Today’s 34% VIX Spike and What to Expect Going Forward


With the caveat that this is a limited data set, it is still worth flagging the pattern in which following a 30% one-day VIX spike, there appears to generally be a tradable oversold condition in stocks that lasts approximately one week,
followed by a period of another month or so in which the markets typically has difficulty coming to terms with the threat to stocks.

One quarter later, however, all fears are generally in the rear view mirror and stocks are likely to have tacked on significant gains.

Image
tsf
Posts: 539
Joined: Tue Feb 15, 2011 7:49 am

Re: 09/10/2016 Weekend Update

Post by tsf »

https://pugsma.wordpress.com/denalis-tu ... ints-2016/

Denali’s Turning Points 2016

Election Year Pattern as of 2012

The election year pattern is as follows:
* Typical pattern sees a peak in September
* Pullback ends in late Sep / early October and market bounces
* An October bounce top – these are generally in mid October, but as they tend to be oversold bounces, they have varied
* A final pullback during the latter part of October
* A peak right around election
* A final low for the year in Mid November
* Year End Rally or at least a rally in to late November
johnnywa
Posts: 1030
Joined: Tue Aug 23, 2011 11:09 am

Re: 09/10/2016 Weekend Update

Post by johnnywa »

Are you kidding me Cobra,"pullback may have started today"really?Your better than this
johnnywa
Posts: 1030
Joined: Tue Aug 23, 2011 11:09 am

Re: 09/10/2016 Weekend Update

Post by johnnywa »

This pullback has a minimum of another 3% down,dont mind weak Monday bounce
User avatar
Out of Bounds
Posts: 5623
Joined: Wed Feb 23, 2011 10:11 am
Location: Miami

Re: 09/10/2016 Weekend Update

Post by Out of Bounds »

I've been short and patient about it for two months. Then today I have to go out of town and I'm locked in a concrete bunker in the middle of nowhere with no internet or phone. So cold I had to wear a sweatshirt.
I emerge to the sunlight and blazing heat, start my car and blast the A/C, and pull up Cobra's 2 day 5 minute SPY chart and start jumping for joy.

I was within a kitten's whisker of hitting my target but missed. Lowering target a bit now to capture any follow through on Monday. If I don't get that, I will delete target and establish a trailing stop to follow new trend down.
...
User avatar
Cobra
Site Admin
Posts: 58982
Joined: Sat Feb 12, 2011 10:29 pm

Re: 09/10/2016 Weekend Update

Post by Cobra »

The next week's stock picks are here:
viewtopic.php?f=10&p=229654#p229654

Like to read more of my commentaries? Please subscribe my Daily Market Report.
Subscribers can find all the members only posts HERE.
StockCharts members, please vote for me HERE, thanks.
johnnywa
Posts: 1030
Joined: Tue Aug 23, 2011 11:09 am

Re: 09/10/2016 Weekend Update

Post by johnnywa »

Out of Bounds wrote:I've been short and patient about it for two months. Then today I have to go out of town and I'm locked in a concrete bunker in the middle of nowhere with no internet or phone. So cold I had to wear a sweatshirt.
I emerge to the sunlight and blazing heat, start my car and blast the A/C, and pull up Cobra's 2 day 5 minute SPY chart and start jumping for joy.

I was within a kitten's whisker of hitting my target but missed. Lowering target a bit now to capture any follow through on Monday. If I don't get that, I will delete target and establish a trailing stop to follow new trend down.
Damn good for you,that shit happens to me all the time when I cant watch the market for couple of hours
johnnywa
Posts: 1030
Joined: Tue Aug 23, 2011 11:09 am

Re: 09/10/2016 Weekend Update

Post by johnnywa »

tsf wrote:https://pugsma.wordpress.com/denalis-tu ... ints-2016/

Denali’s Turning Points 2016

Election Year Pattern as of 2012

The election year pattern is as follows:
* Typical pattern sees a peak in September
* Pullback ends in late Sep / early October and market bounces
* An October bounce top – these are generally in mid October, but as they tend to be oversold bounces, they have varied
* A final pullback during the latter part of October
* A peak right around election
* A final low for the year in Mid November
* Year End Rally or at least a rally in to late November
Bradly turn 28th thought it would be high,now could be a low,i think a turn on 10/16
User avatar
Al_Dente
Posts: 28535
Joined: Thu Jul 21, 2011 2:29 pm

Re: 09/10/2016 Weekend Update

Post by Al_Dente »

AFTER THE CLOSE:
Hanjin won court protection for its ships bound for the U.S., allowing the company to unload four vessels without fear of having them seized by creditors.
Shipper has around $14 billion of goods adrift.
http://www.bloomberg.com/news/articles/ ... -off-ships
Disclaimer: I am not an investment advisor. This is just my opinion NOT investment advice.
User avatar
Out of Bounds
Posts: 5623
Joined: Wed Feb 23, 2011 10:11 am
Location: Miami

Re: 09/10/2016 Weekend Update

Post by Out of Bounds »

Usually a Fib retrace involves a fake or two and then a move with one or two legs. Then it hits the 38.2 mark and we sort of expect the bull to resume.

This is something else because of an incredible, historic stable top and a relatively violent jolt downwards. I suspect we might very well see a thrust to 61.8%.

But I am not sure that the bull is really over. If we break 1981, the bears have settled in and are not leaving.
Attachments
3.JPG
...
daytradingES
Posts: 2245
Joined: Thu Sep 13, 2012 10:46 am

Re: 09/10/2016 Weekend Update

Post by daytradingES »

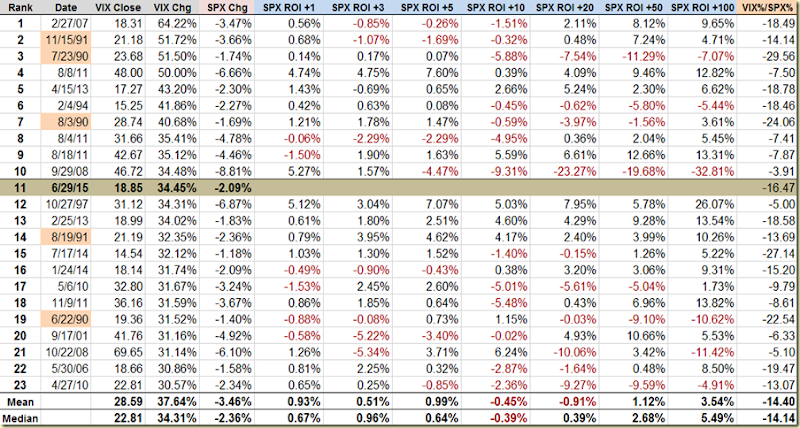
from this mornings reading:

------
"Jerry Welch, Commodity Insite!
Call me at 406 -682 -5010
Ennis, Montana 59729


The session is quite young but also quite bearish for the entire Big Four: stocks, bonds, currencies and commodities. Stocks as measured by the Dow Jones ae 140 lower, bonds that dropped a whopping 2 full points and few ticks yesterday are down another full point and 23 ticks today. All major currencies are lower except the dollar which is King and on the plus by 46 points. And commodities as gauged by the CRB Index is in the red by 196 points. It is one ugly day!


The weakness is no surprise. Yesterday on Inside Futures I posted a brief piece entitled, Punt On First Down and one paragraph read, “Based on what I am witnessing this morning, there is not a market anywhere I would carry into tomorrow. Not a one. In fact, some of my more sensitive technical work is suggesting aggressive traders and investors can sell anything today on hopes that everything will be lower again tomorrow.”


The final paragraph stated, “My old high school football team had so little confidence that oftentimes we would punt on first down. Yes, that is how little confidence we had. We would punt on first down. And that is how I feel about today. If you are bullish anything…anything the wise thing to do is to punt!


Bonds are a leading indicator market for stocks as well as for commodities. This morning, bonds are under heavy selling pressure and at a new, four month low. The weakness with bonds has the down 140 points lower. My rule of thumb that I have mentioned time and again on Inside Futures is this: a close in the Dow of 125 points or more lower on a Friday, bodes exceptionally ill for the following week.

There is nary a market on the plus except for the juice that comes from an orange, few cattle contracts and soybean oil. Almost without exception, all other markets, stocks, bonds, all the major currencies and the CRB Index are lower to sharply lower. The day is breathtakingly bearish and with bonds into a new 4 month low and stocks on the cusp of being in a world of hurt, the rest of the day and all next week could be more of the same.


For today, avoid the long side of any market. Sell rallies as there should be follow thru weakness next week. However, the only two markets I would probe on the short side here and now and press them going into the close are stocks, shares, equities the Dow and the oinkers. Sell them hard and look for a great deal of weakness all next week.


The time is 9:07 a.m. Chicago

http://insidefutures.com/article/178492 ... 20Day.html
--------
that he posted this so early in the day and his prior day was correct is interesting.
for my part I cam very glad to see the break.

My "line in the sand" was 2141 (Sept contract) and we convincing smashed this in the ES
(I switch to Dec on Monday)
Educational only and not trading advice (EO&NTA) :)
Good trading to all
tsf
Posts: 539
Joined: Tue Feb 15, 2011 7:49 am

Re: 09/10/2016 Weekend Update

Post by tsf »

Sep 10, 2016
Source: Dana Lyons @JLyonsFundMgmt


Image


Sep 10, 2016
Source: Cam Hui, CFA @HumbleStudent
analysis of narrow $SPX consolidations resolve w/big 1 day drop+recovery
http://jlfmi.tumblr.com/post/1497666058 ... ic-heights

Image
User avatar
Out of Bounds
Posts: 5623
Joined: Wed Feb 23, 2011 10:11 am
Location: Miami

Re: 09/10/2016 Weekend Update

Post by Out of Bounds »

SNOG info for those interested.
_________________________
Through Thursday
1a.JPG
_________________________
Data through Friday
1b.JPG
_________________________
Longer Time frame to put SNOG into perspective
1c.JPG
_________________________
Last couple of weeks in June to see another
example of SNOG extremes. Current values are
on red on the right side of the chart
1d.JPG
...
fehro
Posts: 22880
Joined: Fri Sep 02, 2011 2:06 pm

Re: 09/10/2016 Weekend Update

Post by fehro »

Weekly Daily candles. One day and we are back to 16 months ago highs. Daily and Weekly candles ugly. Weekly only the VIX and the dollar kinda leans bullish.
Attachments
Daily
Daily
Weekly
Weekly
Last edited by fehro on Sat Sep 10, 2016 8:06 pm, edited 1 time in total.
fehro
Posts: 22880
Joined: Fri Sep 02, 2011 2:06 pm

Re: 09/10/2016 Weekend Update

Post by fehro »

Industry % Weekly
Attachments
Screen Shot 2016-09-10 at 4.59.34 PM.png
fehro
Posts: 22880
Joined: Fri Sep 02, 2011 2:06 pm

Re: 09/10/2016 Weekend Update

Post by fehro »

T2 http://www.worden.com/TeleChartHelp/Con ... rs_T2s.htm

As per last weekend % stocks >40d were weak, now got hammered to 36%
Attachments
Screen Shot 2016-09-10 at 5.00.16 PM.png
fehro
Posts: 22880
Joined: Fri Sep 02, 2011 2:06 pm

Re: 09/10/2016 Weekend Update

Post by fehro »

T2 Channels % Stocks 1+2 Channels ><200d Weekly ><40d Daily
Attachments
Screen Shot 2016-09-10 at 5.03.25 PM.png
Post Reply