Source:
https://sixfigureinvesting.com/2017/11/ ... l-the-vix/
There are a lot of models for the Cboe’s VIX. None of them are particularly good at predicting what the VIX will do tomorrow but they can be useful in predicting general behaviors of the VIX. The most popular model for the VIX (although people might not recognize it as a model) is simple mean reversion.
Simple Mean Reversion
Car gas mileage is a good example of a simple mean reverting process.
Over time your car’s gas mileage will exhibit an average value, e.g., 28 miles per gallon. You don’t expect to get the same mileage with every tank because you know that there are factors that make a difference with your mileage (e.g., city vs highway driving, tire air pressure, and wind direction) but over time you expect your mileage to cluster around that average value. If you get 32 miles per gallon on one tank of gas you reasonably expect that next time you check it will likely be closer to 28. If the values start varying significantly from the average you start wondering if something has changed with the car itself (e.g., needs a tune-up)
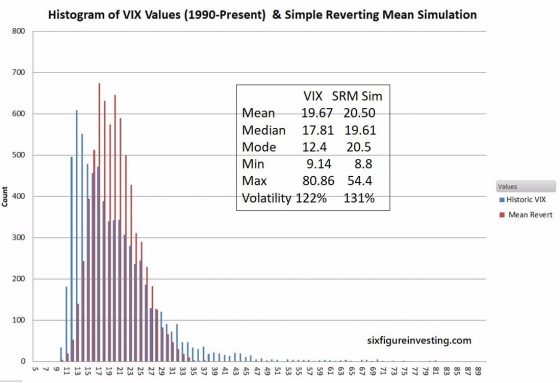
A mean-reverting random walk is a relatively simple model and fits some of the basic behaviors of the VIX. Specifically, over time the mean value of the VIX has stayed stable at around 20 and the VIX exhibits range bound behavior—with all-time lows around 9 and all-time highs around 80.
However, there are many aspects of the VIX that aren’t well explained by a simple mean-reverting model. For example, a simple mean reverting process will have its mode value (the most frequently occurring values) close to its mean. This is not the case of the VIX; its mode is around 12.4—a long way away from its mean. The histograms below show that difference visually.

+290 points


