Page 9 of 13
Re: 01/17/2013 Live Update
Posted: Thu Jan 17, 2013 3:05 pm
by fehro
channel top still higher.
Re: 01/17/2013 Live Update
Posted: Thu Jan 17, 2013 3:07 pm
by Al_Dente
Somebody posted a Demark video link the other day, where he said 13 days up = max
And they don’t have to be consecutive days up
13 days up = exhaustion
He counted today as #13 (?)
I don’t get that count
Can someone clarify Demark please?
Re: 01/17/2013 Live Update
Posted: Thu Jan 17, 2013 3:09 pm
by Cobra
Re: 01/17/2013 Live Update
Posted: Thu Jan 17, 2013 3:10 pm
by TraderGirl
Apple reversal candle...
Re: 01/17/2013 Live Update
Posted: Thu Jan 17, 2013 3:11 pm
by skittlesmds
Al_Dente wrote:Somebody posted a Demark video link the other day, where he said 13 days up = max
And they don’t have to be consecutive days up
13 days up = exhaustion
He counted today as #13 (?)
I don’t get that count
Can someone clarify Demark please?
I think they are based on a percentage or something (not just an positive day).
Re: 01/17/2013 Live Update
Posted: Thu Jan 17, 2013 3:11 pm
by fehro
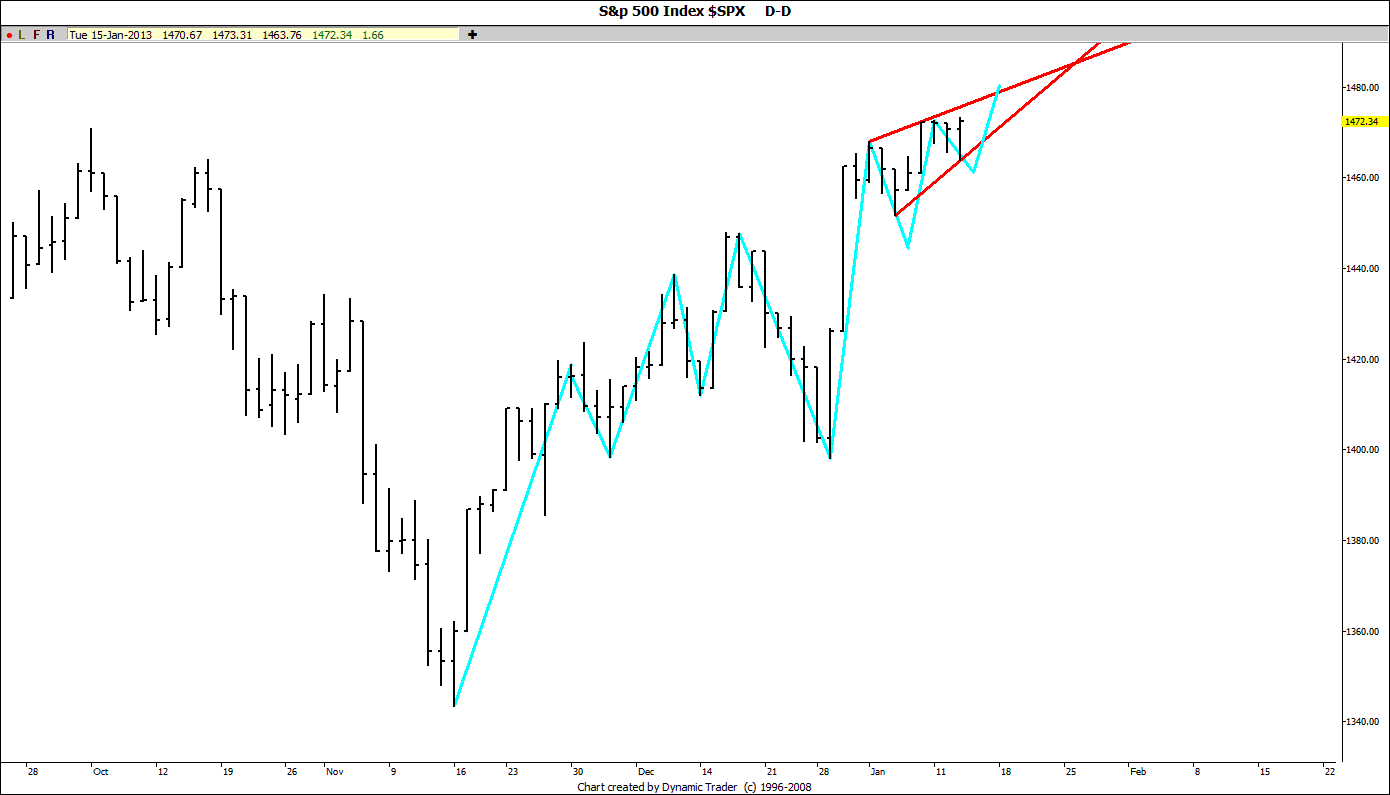
or even higher?... pink wedge?..SPX daily.. riding the underside of the channel
Re: 01/17/2013 Live Update
Posted: Thu Jan 17, 2013 3:14 pm
by rc1269
next stop is 1448 over the next few weeks. IMO. then continue the rally
Re: 01/17/2013 Live Update
Posted: Thu Jan 17, 2013 3:14 pm
by Al_Dente
Relative strength
Color coded

Re: 01/17/2013 Live Update
Posted: Thu Jan 17, 2013 3:14 pm
by TraderGirl
DZZ...tried to bust below triangle...but held...for now..
Re: 01/17/2013 Live Update
Posted: Thu Jan 17, 2013 3:15 pm
by jarbo456
skittlesmds wrote:Al_Dente wrote:Somebody posted a Demark video link the other day, where he said 13 days up = max
And they don’t have to be consecutive days up
13 days up = exhaustion
He counted today as #13 (?)
I don’t get that count
Can someone clarify Demark please?
I think they are based on a percentage or something (not just an positive day).
if it were that easy to figure out, then we'd not have to pay for the indicator yeah?

with that being said, it's something along those lines of price and volume aggregated over a 2 day period i believe.
i don't think he's counting today, from the bloomberg video, he was looking for something around 1492?
Re: 01/17/2013 Live Update
Posted: Thu Jan 17, 2013 3:15 pm
by jarbo456
cobra...
word on your long term vix chart? i saw a touch of the trendline today...
can you confirm the same on your chart?
Re: 01/17/2013 Live Update
Posted: Thu Jan 17, 2013 3:16 pm
by Hubon
It is a little bit complicated as counts can get erased and then the system starts to recount, but here is an example I got for Apple, also, you can do this in different time frames.
Re: 01/17/2013 Live Update
Posted: Thu Jan 17, 2013 3:17 pm
by TWT
$SPX: Since the ED is dead I have to work with this new count
Re: 01/17/2013 Live Update
Posted: Thu Jan 17, 2013 3:17 pm
by Al_Dente
skittlesmds wrote:Al_Dente wrote:Somebody posted a Demark video link the other day, where he said 13 days up = max
And they don’t have to be consecutive days up
13 days up = exhaustion
He counted today as #13 (?)
I don’t get that count
Can someone clarify Demark please?
I think they are based on a percentage or something (not just an positive day).
thanks

He always says shite that u can’t quite figure out unless u spend a zillion dollars for his service…. oy
http://www.youtube.com/watch?v=hxEU6wZhfZ4
Re: 01/17/2013 Live Update
Posted: Thu Jan 17, 2013 3:18 pm
by TraderGirl
Al_Dente wrote:Relative strength
Color coded

117relstr.png
Financials and industrials leading lately....small caps and tech are usually reactionary...
Re: 01/17/2013 Live Update
Posted: Thu Jan 17, 2013 3:21 pm
by BullBear52x

even the blame it on Batteries BA is up.

darned batteries
Re: 01/17/2013 Live Update
Posted: Thu Jan 17, 2013 3:23 pm
by skittlesmds
Anyone making bets on Chinese economy data for tomorrow?
Re: 01/17/2013 Live Update
Posted: Thu Jan 17, 2013 3:24 pm
by silversurfer
1/18-21 Time and Cycle High, target 1485 SPX
http://timeandcycles.blogspot.com/

Merlin 1/17 High
http://chartsedge.com/

Re: 01/17/2013 Live Update
Posted: Thu Jan 17, 2013 3:24 pm
by Al_Dente
jarbo456 wrote:skittlesmds wrote:Al_Dente wrote:Somebody posted a Demark video link the other day, where he said 13 days up = max
And they don’t have to be consecutive days up
13 days up = exhaustion
He counted today as #13 (?)
I don’t get that count
Can someone clarify Demark please?
I think they are based on a percentage or something (not just an positive day).
if it were that easy to figure out, then we'd not have to pay for the indicator yeah?

with that being said, it's something along those lines of price and volume aggregated over a 2 day period i believe.
i don't think he's counting today, from the bloomberg video, he was looking for something around 1492?
jarb could u “take one for the board”
cough up the zillion bucks
subscribe
then post all his proprietary shite here
thanks ever so much

Re: 01/17/2013 Live Update
Posted: Thu Jan 17, 2013 3:24 pm
by ClarkW
Al_Dente wrote:Somebody posted a Demark video link the other day, where he said 13 days up = max
And they don’t have to be consecutive days up
13 days up = exhaustion
He counted today as #13 (?)
I don’t get that count
Can someone clarify Demark please?
I don't know who posted the article and I know little about how they are calculated. Think or Swim has a TD Sequential Indicator where it calculates it for you.
On /ES Weekly looks like we are about to hit 13. Already there on daily

