Page 2 of 3
Re: 08/04/2012 Weekend Update
Posted: Sat Aug 04, 2012 6:15 pm
by TraderGirl
SPX might be in an ending diagonal??? If so, there could be resistance around 1400...
There is a turn on Tuesday....
Re: 08/04/2012 Weekend Update
Posted: Sat Aug 04, 2012 7:14 pm
by joe-gamma
Cobra wrote:The story this weekend is the Smart Money is record short. This is not a good sign but sometimes it takes months to realize, so might not be an immediate threat.
Does this "smart money" data include Friday?
IF so, they were taking advantage of market strength to sell more.
Hope boardies are having great weekend!
Re: 08/04/2012 Weekend Update
Posted: Sat Aug 04, 2012 7:19 pm
by joe-gamma
Al_Dente wrote:Good morning weekenders
Correlation between SPY and the other indices
(Above .50 is considered positive correlation, with 1.0 being perfect 100% correlation.
Below .50 is negative corr, with -1.0 being 100% neg corr.)
84wkndcorr.png
Happy weekend wise AL: great perception you made late Thursday afternoon

Does the recent move away from SPY corr by IWM and Tran look similar to March 2012?
maybe a corrective move to shake a few weak longs then move to new highs next week/ later this month?
Re: 08/04/2012 Weekend Update
Posted: Sat Aug 04, 2012 9:52 pm
by Al_Dente
PAGING TRADERGIRL
Neon turquoise blue is OBV
“Complacency” usually means no-fear-bull-spy, until TOO MUCH complacency turns into the reversal signal. (U know all that).
The trick is in the timing, as usual…
Yes, because XIV is newish, let’s use 15 years on the oldie $VIX instead...
We usually associate $VIX below 20 with “all clear” bull runs, but “Smart Guy” Bill Luby over at vixandmore has made me re-think this.
He noted that $VIX lows in the 15-18 zone (15%-18% volatility) “usually correspond” to SPY top zones.
I thought this was nonsense, but when I charted it…. I’ll be darned !!!
You can see the EPIC EXCEPTION in the bull run of 2004 - 2007 (blue box = low $VIX = persistently higher SPY)
But if u look at the other instances when $VIX is 15-18 (orange boxes), u see SPY top zones !!!
[This is long term weekly; zoom in on a daily view and u see it takes weeks/months to play out]
[btw: Quick answer is: Yes, XIV is now outperforming SPY, which I interpret as bullish at the moment IMHO]
Update on the LT [edit: INVERTED] volatility-signals chart shows the call buying spike (pink boxes) which delayed the sell signal (it needs to move down below the signal line for “sell” signal]
Final note: SPY made a fresh high yesterday; $VIX did not make a fresh low = non-confirmation… we’ll watch … sometimes it does confirm a few days later…sometimes not.
Re: 08/04/2012 Weekend Update
Posted: Sat Aug 04, 2012 9:56 pm
by Al_Dente
joe-gamma wrote:Al_Dente wrote:Good morning weekenders
Correlation between SPY and the other indices
(Above .50 is considered positive correlation, with 1.0 being perfect 100% correlation.
Below .50 is negative corr, with -1.0 being 100% neg corr.)
Happy weekend wise AL: great perception you made late Thursday afternoon
hi joe: what did i say that was smart on thursday? i don't remember
Does the recent move away from SPY corr by IWM and Tran look similar to March 2012?
maybe a corrective move to shake a few weak longs
beats me...
then move to new highs next week/ later this month?
Seriously i have no clue
Re: 08/04/2012 Weekend Update
Posted: Sun Aug 05, 2012 1:50 am
by TradingJackal
Now, I am not a doomer gloomer. Being a Jackal, I live on scraps left behind by the wolves and try not become their next meal

Having said this, it is clear that Europe will lead the world down this time. I don't think Ben will print in Sept. It is too close to the elections and will barely have any impact. Spain, Italy and others in Europe are too big to be 'too big to fail' so they will get what is due to them and with them, the rest of us.
Based on this premise, the following chart shows us close to finishing up the corrective wave to the upside since the bottom in March 2009. In EWT, corrections are zig-zag (5-3-5) or Flat (3-3-5). It is tough for me to say whether the previous downleg was a 3 wave or a 5 wave structure. Needless, we have a good 3 wave structure to the upside as presented in the chart. If it pans out as shown, we should top out at less than 144 on SPY. The downside should last at least well into 2014 while the world deals with the situation in Europe.
I am out of my long-term longs and am sticking with daytrading a few handles up or down on ES till this situation is sorted out.
Re: 08/04/2012 Weekend Update
Posted: Sun Aug 05, 2012 2:07 am
by TraderGirl
Al_Dente wrote:PAGING TRADERGIRL
Neon turquoise blue is OBV
“Complacency” usually means no-fear-bull-spy, until TOO MUCH complacency turns into the reversal signal. (U know all that).
The trick is in the timing, as usual…
Yes, because XIV is newish, let’s use 15 years on the oldie $VIX instead...
We usually associate $VIX below 20 with “all clear” bull runs, but “Smart Guy” Bill Luby over at vixandmore has made me re-think this.
He noted that $VIX lows in the 15-18 zone (15%-18% volatility) “usually correspond” to SPY top zones.
I thought this was nonsense, but when I charted it…. I’ll be darned !!!
You can see the EPIC EXCEPTION in the bull run of 2004 - 2007 (blue box = low $VIX = persistently higher SPY)
But if u look at the other instances when $VIX is 15-18 (orange boxes), u see SPY top zones !!!
[This is long term weekly; zoom in on a daily view and u see it takes weeks/months to play out]
[btw: Quick answer is: Yes, XIV is now outperforming SPY, which I interpret as bullish at the moment IMHO]
The attachment 84wkndvix.png is no longer available
Update on the LT [edit: INVERTED] volatility-signals chart shows the call buying spike (pink boxes) which delayed the sell signal (it needs to move down below the signal line for “sell” signal]
Final note: SPY made a fresh high yesterday; $VIX did not make a fresh low = non-confirmation… we’ll watch … sometimes it does confirm a few days later…sometimes not.
The attachment 84wkndvix2.png is no longer available
Nice chart Al, as always....
We are in that support zone again, still with pos d, we'll see if Tuesday turns the VIX up again....
Re: 08/04/2012 Weekend Update
Posted: Sun Aug 05, 2012 6:10 am
by KeiZai
Thanks boardies for great charts this weekend
update of AUD/USD plan
USD/CAD is setting up for take off
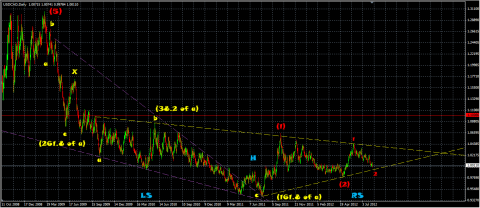
- inverse H&S
Why I am paying so much attention to currencies? Because they say it better what is really going on
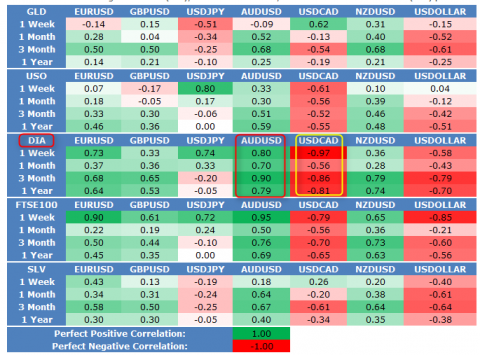
- correlation
Correlation between CAD and SPX
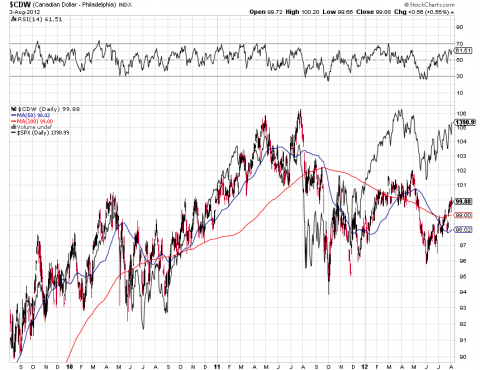
- levitation - but for how long?
Dollar update (looks constructive to me, so far nothing extra bearish)
Re: 08/04/2012 Weekend Update
Posted: Sun Aug 05, 2012 9:39 am
by Mr. BachNut
Wow. You guys are on fire this weekend. Great stuff.
Cobra, A+ on the outlook and evil plan.
Keizai, Right on man. Currency markets are key. Worth noting that AUD and CAD are the commodity currencies.
Al D, The VIX low top signal is muy bueno. I think many have sensed that intuitively. Great to see data.
Taggard, I believe price action moves to distract and deceive. The market gives what the most perceptually need to get on the wrong side of the trade. So, hard to deal with too. A lot of heads have been spun the last few days and weeks.
I am a bit agnostic at the moment on what lies ahead near term as I have got bullish signals firing pretty far along in what looks like a corrective topping pattern. (Also, I am spending too much time at the beach to have a strong view on anything right now!). I need to reflect some more to try and come up with something worthy of posting along side you guys.
In the mean time, here is a repeat chart updating the big three fan line pattern. It goes along with Cobra's long term evil plan. As you can see, the decline to June 4 did not cut it volume wise to qualify as a serious correction. So, the action has been bullish but potential energy to the downside did not clear and remains available for a future quake. I am not sure how much weight to place on a break of the declining tops line, but should that third of the rising fan lines break,


.
I know a lot of people don't like the NYA because it includes closed-end funds including fixed income products, but I think it has a place. One, it is pretty comprehensive. So, while the Dow and S&P may get pushed one way while the Russell is doing something different, this is one way to get a more inclusive view (there are other ways too). Two, in the bad bear markets, a lot of those closed end funds get clunked too.
Re: 08/04/2012 Weekend Update
Posted: Sun Aug 05, 2012 10:51 am
by Al_Dente
THANK YOU ALL WEEKENDERS FOR GREAT STUFF
PAGING Trading Jackal: U may or may not be aware of the fact that the jackal is NOT AFRAID OF ANY little honey badger.
PAGING BARON von BB52x: I thought u were joking. Turns out Snoop Dogg really did change his name to “Snoop Lion.”
Sooooooo……. after pondering this… I have decided I shall now change my name to:
“The Chartist Formerly Known as Al Dente”
On a very serious note: This is the first time since April that the semiconductors, third panel [edit: are trying to catch up to SPX] on relative strength
….. What’s up?
Friday’s spike did not budge our Offensive/Defensive Ratio out of its bear stupor…
Etta on Sundays:
http://www.youtube.com/watch?v=nfNLspDL3ns
Re: 08/04/2012 Weekend Update
Posted: Sun Aug 05, 2012 11:27 am
by Al_Dente
Re: 08/04/2012 Weekend Update
Posted: Sun Aug 05, 2012 12:32 pm
by Harapa
Here is VIX vs SP500 and RUT chart since 1990 that may be of interest to folks with LT or ST orientation. Here is my take of the chart.
1. Market can go up with VIX in falling trend (92-94, 03-07) or rising trend (95-00, 2007). So purely looking at trend may not be a good guide of future price behavior.
2. Between 92-2000 and 2003-present VIX followed two trend lines, touch of these lines served a turning point in stock prices in many cases. Also, a rise above 35 and than fall coincided with major market bottoms.
3. Presently, VIX needs to fall to ~13 to reach the trend line. If history repeats itself, a touch of the TL may coincide with a market top of some significance.Till than enjoy the ride!
Re: 08/04/2012 Weekend Update
Posted: Sun Aug 05, 2012 1:08 pm
by Harapa
Status of Momentum Block:
Except Small Caps (which can move to "buy" if IWM holds at this level on Monday) all asset classes have positive momentum. Of note is a change of ECRI's leading indicator based market timing model (WLIg Derived Model) to a buy from a tentative sell that was in place since Jun 1st. This set up has a 100% win rate since 1966. It is a long term signal which offers support for higher prices in weeks to months to come (it has no power to predict what may happen next week).
Status of Small Cap:
Small caps seems to be the weakest link.
A down slopping trend line kept a damper on R2K advance Friday, actually it was struggling to reach it at the close of FRI. On the other hand SP500 made a HH. For R2K to be labelled bullish, it needs to break above the trend line (currently ~ 790). Next resistance may be ~ 806. Watch action in Sunday night futures market to see if it manages to brake out else it may be destined to the bottom TL.
Re: 08/04/2012 Weekend Update
Posted: Sun Aug 05, 2012 1:11 pm
by Al_Dente
STOCKCHARTS MEMBERS ALERT
Stockcharts just added 2-minute, 3-minute, and 2-hour bar chart features
(below your chart go to > chart attributes > periods >drop down > 2 min……..etc)
Re: 08/04/2012 Weekend Update
Posted: Sun Aug 05, 2012 1:14 pm
by Harapa
KeiZai wrote:Why I am paying so much attention to currencies? Because they say it better what is really going on
KeiZai, my back testing shows that buying or selling SPY or IWM purely on the momentum of AUDJPY and USDCAD can be very profitable. Have you looked at correlation of various asset classes with AUD/JPY pair?
Re: 08/04/2012 Weekend Update
Posted: Sun Aug 05, 2012 1:28 pm
by Mr. BachNut
A little off topic:
Last week I went into the comment section of another technical blog, which will go un-named.
Trolls had taken over to a degree I had not witnessed before. The volume and intensity of the attacks and garbage posts was truly amazing.
Any technical work or view right or wrong that conflicted with someone else was treated with ridicule and hostility.
It was not safe for open dialog and sharing of ideas.
It made me truly appreciate Cobra's management of this site, which I am sure has not been easy at times.
Thank you Cobra!
Re: 08/04/2012 Weekend Update
Posted: Sun Aug 05, 2012 1:39 pm
by Mr. BachNut
Speaking of AUD JPY, Friday looks like a bullish breakout above resistance and perhaps a bit of an ascending triangle to boot.
If this doesn't fail tomorrow, the trend continues up providing some potential lift for equities.
P.S. Note it is a 2 day chart if it looks a little funny, but 1 day chart shows same thing. Just don't ask me why I do this...

Re: 08/04/2012 Weekend Update
Posted: Sun Aug 05, 2012 3:23 pm
by joe-gamma
Mr. BachNut wrote:A little off topic:
Last week I went into the comment section of another technical blog, which will go un-named.
Trolls had taken over to a degree I had not witnessed before. The volume and intensity of the attacks and garbage posts was truly amazing.
Any technical work or view right or wrong that conflicted with someone else was treated with ridicule and hostility.
It was not safe for open dialog and sharing of ideas.
It made me truly appreciate Cobra's management of this site, which I am sure has not been easy at times.
Thank you Cobra!
Thanks to Cobra and Bach: i hae alwys found it diccicult to be open-minded toward growh when I am either defensive or in the mood to ridicule...thanks for an informative climate to learn!
Re: 08/04/2012 Weekend Update
Posted: Sun Aug 05, 2012 3:27 pm
by Al_Dente
SHORT TO INTERMEDIATE TERM……….TREND v RANGE
I use ADX and a longer tweaked STO and an MA support cushion to identify if we are in a SPY “trend” or “range.”
Anything I hold intermediate term tends to get chopped up when we are in range mode, as the whipsaws take out stops on the upside and on the downside, and profits suffer.
When I can identify the start of a “real” trend, either way, I try to go very heavy, short-to-intermediate term, as opposed to going light in “ranges.”
Right now we are still in a range IMHO.
HERE IS MY QUESTION: does anyone have other decent TREND FINDER tools or strategies that u could share, as it would benefit us all.
My settings here are STO 30 and ADX 8 but u need 2 use your favorite settings that work best for u.
[ps Mr. Bachnut thanks for your post(s)]
Re: 08/04/2012 Weekend Update
Posted: Sun Aug 05, 2012 3:31 pm
by joe-gamma
Al_Dente wrote:THANK YOU ALL WEEKENDERS FOR GREAT STUFF
PAGING Trading Jackal: U may or may not be aware of the fact that the jackal is NOT AFRAID OF ANY little honey badger.
PAGING BARON von BB52x: I thought u were joking. Turns out Snoop Dogg really did change his name to “Snoop Lion.”
Sooooooo……. after pondering this… I have decided I shall now change my name to:
“The Chartist Formerly Known as Al Dente”
On a very serious note: This is the first time since April that the semiconductors, third panel [edit: are trying to catch up to SPX] on relative strength
….. What’s up?
84wkndsox.png
Friday’s spike did not budge our Offensive/Defensive Ratio out of its bear stupor…
85wkndoffensive.png
Etta on Sundays:
http://www.youtube.com/watch?v=nfNLspDL3ns
Wise Al: you will need more purple in your charts before you can change to the 'formerly known as' me...

As for thursday's wisdom: you said something like that bounce has big legs or you are a big spaghetti-face, but I did the "right" thing and stuck to my trade, now wish I had lightened up on puts a bit....
always a challenge, being my own worst enemy, trying to be more accurate when market failed to behave as I planned for, Versus letting market algos shake out my convictions causing me to miss the move
