Back to www.cobrasmarketview.com |

Hi dtesdaytradingES wrote:Hi Al,
Looking at the chart you posted it doesn't look like cumulative Tick is not effective for intraday turns, is that what you see?
Below is the tick and price

THANK YOU VERY MUCH ROYALRoyal Flush wrote:Some individuals maintain that the market is very close to triggering the third Zweig Breadth Thrust since the 2009 low. The other two are highlighted in Blue. These were "kickoff" thrusts of major legs up.
StockChart's ZBT chart is no where close to giving a signal. The construction of the chart and associated signal is described here:
http://stockcharts.com/commentary/archi ... 1101h.html
The green chart below shows the Oct 2011 signal (red MA10).
My question for those who have an understanding of the Zweig Breadth Thrust Indicator is which one is correct?
Boss I really appreciate the “inset” charts u use to explain the wave stuff to newbies and moiKeiZai wrote:Dollar index update
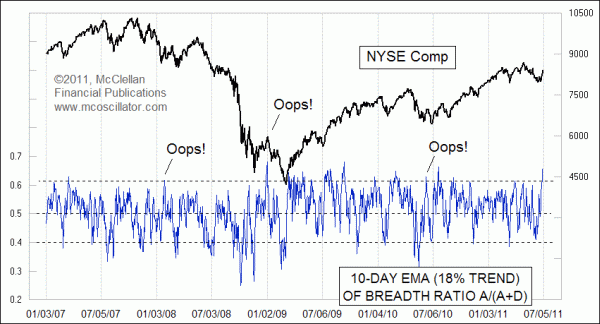
I'm even more confused now. I started looking up definitions of the Zweig Breadth Thrust. McClellan mentions 10day EMA of advances/total issues:Al_Dente wrote:THANK YOU VERY MUCH ROYALRoyal Flush wrote:Some individuals maintain that the market is very close to triggering the third Zweig Breadth Thrust since the 2009 low. The other two are highlighted in Blue. These were "kickoff" thrusts of major legs up.
StockChart's ZBT chart is no where close to giving a signal. The construction of the chart and associated signal is described here:
http://stockcharts.com/commentary/archi ... 1101h.html
The green chart below shows the Oct 2011 signal (red MA10).
My question for those who have an understanding of the Zweig Breadth Thrust Indicator is which one is correct?
Your top chart is correct (so is T2103 on freestockcharts.com)
Zweig says it needs to go from under 41 to “above 60 in less than 10 days”
It’s at 59.67 and it has only been 5 days……
(the stockcharts.com 41/60 lines are wanky)
[edit: Because on the stockcharts.com configuration you would have to have the 41 and 60 lines on the 10 sma of the $RHNYA.
(and I can’t figure out how to do that)
You can’t have the 41 and 60 lines on the straight $RHNYA]
IMHO
Yes boss, sooner or later but now the question is, is the correction in dollar over or will be more complex?Al_Dente wrote:Boss I really appreciate the “inset” charts u use to explain the wave stuff to newbies and moiKeiZai wrote:Dollar index update
Re: dollar DXY
Does that mean to expect a possible breakdown of your 80.11 support line?
(just trying to figure if I am reading it right or wrong)
THANKS
 Most simple correction (smaller picure) is completed and if prior trend resumed then we are in first wave down followed by small 3 waves up etc. but if this correction will be more complex (X) then there is more upside ahead in medium term (bigger picture)
 that´s why I switched to dollar bear (commodity bull) at 81.25


hi Al,Al_Dente wrote:Hi dtesdaytradingES wrote:Hi Al,
Looking at the chart you posted it doesn't look like cumulative Tick is not effective for intraday turns, is that what you see?
Below is the tick and price
that one is regular tick not cumulative
i like watching regular tick on 1min and 5min just for scalping intraday, as it can confirm/deny an intraday move...
GL2u

I've seen a trading system with intra-day cumulative ticks a while back that uses a number of panes.Al_Dente wrote:Thanks cobraCobra wrote:A friend sent me this: http://seekingalpha.com/article/111289- ... -nyse-tickAl_Dente wrote:Cobra...Cobra wrote:I don't remember I ever saw the NYSE Intra-day cumulative tick this high.
I’m watching essesseme’s INTRADAY cumulative tick to see how quickly it responds to an intraday turn… we’ll see
)