Page 2 of 3
Re: 11/24/2012 Weekend Update
Posted: Sun Nov 25, 2012 8:25 am
by TWT
SPX: Regarding the labelling of the up leg off the November 16 low I maintain the conviction that it is not impulsive, instead in my opinion price has unfolded a Triple Zig Zag.
Since it is a corrective move, price can trace a larger Zig Zag / Double Zig Zag higher but we cannot rule out either that once it is confirmed over price could unfold the last wave (C) down, revisiting the November 16 low with a double bottom or a lower low.
Hence the internal structure of the expected pullback and the skill of Bulls (with the help of PPT) to defend the 200 dma (eod print since an intra-day drop at the last lower high = 1377 cannot be ruled out either) will determine the next directional move.
Re: 11/24/2012 Weekend Update
Posted: Sun Nov 25, 2012 8:27 am
by TWT
EUR: The key critical fight should take place in the currency front, with the EUR acting as “Minos” that will endorse the equity bulls’ wishes (well lets better say Central Bankers plans) or deprive them temporarily from the victory of the final battle which will allow the resumption of the intermediate up trend.
Unfortunately, in my opinion, the path here is not clear.
Despite the fact that the pattern from the September 17 high is obviously corrective I would not rule out that it is not complete yet.
As a matter of fact the down leg off the October 17 high does not look impulsive therefore the November 13 low is a doubtful “major” bottom, in addition the current up leg is clearly corrective hence there is a “underhand” risk that the EUR could be unfolding a large bullish flag that needs one more down leg if price fails at 1.3021 or a large Flat if price once/if it breaks above 1.3021 it fail at the September high.
For the immediate time frame, on Friday price reached the upper Bollinger Band, hence the move is getting stretched.
As for support we have the 50 dma at 1.2910, while an eod print below 1.2876 would open the door if a retest of the 200 dma = 1.2800
Re: 11/24/2012 Weekend Update
Posted: Sun Nov 25, 2012 8:27 am
by TWT
VIX is probably the best indicator that helps in checking for conformity of an equity move.
I want to highlight two issues:
1. It is obvious that at the SPX November 16 low there was not enough fear to validate a major bottom for the equity market, instead we had a bullish divergence.
2. It is also clear that on Friday VIX did not establish a lower low hence we have a bearish divergence for the equity market. But at the same time there is no positive divergence of the RSI, therefore after a rebound that could reach the range between the 50 dma = 16.13 and last Monday´s gap down at 16.41 I expect at least another down leg that could challenge the rising trend line support in force since the August lows = 14.10
If this expected down leg occurs in concordance with a positive divergence of the RSI then it could kick off the awaited spike of the fear index.
Re: 11/24/2012 Weekend Update
Posted: Sun Nov 25, 2012 8:56 am
by KeiZai
Re: 11/24/2012 Weekend Update
Posted: Sun Nov 25, 2012 8:58 am
by KeiZai
Re: 11/24/2012 Weekend Update
Posted: Sun Nov 25, 2012 9:03 am
by KeiZai
Re: 11/24/2012 Weekend Update
Posted: Sun Nov 25, 2012 9:47 am
by Royal Flush
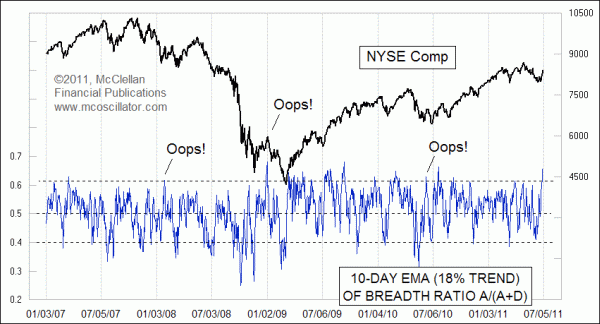
Some individuals maintain that the market is very close to triggering the third Zweig Breadth Thrust since the 2009 low. The other two are highlighted in Blue. These were "kickoff" thrusts of major legs up.
StockChart's ZBT chart is no where close to giving a signal. The construction of the chart and associated signal is described here:
http://stockcharts.com/commentary/archi ... 1101h.html
The green chart below shows the Oct 2011 signal (red MA10).
My question for those who have an understanding of the Zweig Breadth Thrust Indicator is which one is correct?
Re: 11/24/2012 Weekend Update
Posted: Sun Nov 25, 2012 10:35 am
by KeiZai
another not good looking dollar chart : USDNOK
EURJPY
Re: 11/24/2012 Weekend Update
Posted: Sun Nov 25, 2012 1:00 pm
by Al_Dente
daytradingES wrote:Hi Al,
Looking at the chart you posted it doesn't look like cumulative Tick is not effective for intraday turns, is that what you see?
Below is the tick and price
Hi dtes
that one is regular tick not cumulative
i like watching regular tick on 1min and 5min just for scalping intraday, as it can confirm/deny an intraday move...
GL2u

Re: 11/24/2012 Weekend Update
Posted: Sun Nov 25, 2012 1:04 pm
by Al_Dente
Royal Flush wrote:Some individuals maintain that the market is very close to triggering the third Zweig Breadth Thrust since the 2009 low. The other two are highlighted in Blue. These were "kickoff" thrusts of major legs up.
StockChart's ZBT chart is no where close to giving a signal. The construction of the chart and associated signal is described here:
http://stockcharts.com/commentary/archi ... 1101h.html
The green chart below shows the Oct 2011 signal (red MA10).
My question for those who have an understanding of the Zweig Breadth Thrust Indicator is which one is correct?
THANK YOU VERY MUCH ROYAL
Your top chart is correct (so is T2103 on freestockcharts.com)
Zweig says it needs to go from under 41 to “above 60 in less than 10 days”
It’s at 59.67 and it has only been 5 days……
(the stockcharts.com 41/60 lines are wanky)
[edit: Because on the stockcharts.com configuration you would have to have the 41 and 60 lines on the 10 sma of the $RHNYA.
(and I can’t figure out how to do that)
You can’t have the 41 and 60 lines on the straight $RHNYA]
IMHO
Re: 11/24/2012 Weekend Update
Posted: Sun Nov 25, 2012 1:31 pm
by Al_Dente
KeiZai wrote:Dollar index update
Boss I really appreciate the “inset” charts u use to explain the wave stuff to newbies and moi
Re: dollar DXY
Does that mean to expect a possible breakdown of your 80.11 support line?
(just trying to figure if I am reading it right or wrong)
THANKS
Re: 11/24/2012 Weekend Update
Posted: Sun Nov 25, 2012 2:01 pm
by KaZoom
Al_Dente wrote:Royal Flush wrote:Some individuals maintain that the market is very close to triggering the third Zweig Breadth Thrust since the 2009 low. The other two are highlighted in Blue. These were "kickoff" thrusts of major legs up.
StockChart's ZBT chart is no where close to giving a signal. The construction of the chart and associated signal is described here:
http://stockcharts.com/commentary/archi ... 1101h.html
The green chart below shows the Oct 2011 signal (red MA10).
My question for those who have an understanding of the Zweig Breadth Thrust Indicator is which one is correct?
THANK YOU VERY MUCH ROYAL
Your top chart is correct (so is T2103 on freestockcharts.com)
Zweig says it needs to go from under 41 to “above 60 in less than 10 days”
It’s at 59.67 and it has only been 5 days……
(the stockcharts.com 41/60 lines are wanky)
[edit: Because on the stockcharts.com configuration you would have to have the 41 and 60 lines on the 10 sma of the $RHNYA.
(and I can’t figure out how to do that)
You can’t have the 41 and 60 lines on the straight $RHNYA]
IMHO
I'm even more confused now. I started looking up definitions of the Zweig Breadth Thrust. McClellan mentions 10day EMA of advances/total issues:
http://www.mcoscillator.com/data/charts ... Thrust.gif
but stockcharts uses 10 day SMA of new highs/new highs+new lows:
http://blogs.stockcharts.com/dont_ignor ... l?st=zweig
and then these guys argue about the definition:
http://www.traders-talk.com/mb2/index.p ... pic=132174
I have a Breadth Thurst (sic - lol)- can someone tell me which is correct?
Re: 11/24/2012 Weekend Update
Posted: Sun Nov 25, 2012 2:47 pm
by KeiZai
Al_Dente wrote:KeiZai wrote:Dollar index update
Boss I really appreciate the “inset” charts u use to explain the wave stuff to newbies and moi
Re: dollar DXY
Does that mean to expect a possible breakdown of your 80.11 support line?
(just trying to figure if I am reading it right or wrong)
THANKS
Yes boss, sooner or later but now the question is, is the correction in dollar over or will be more complex?

Most simple correction (smaller picure) is completed and if prior trend resumed then we are in first wave down followed by small 3 waves up etc. but if this correction will be more complex (X) then there is more upside ahead in medium term (bigger picture)
My personal opinion is that dollar is finished and is going to 74

that´s why I switched to dollar bear (commodity bull) at 81.25

next week we will know the answer and I will let u know

Re: 11/24/2012 Weekend Update
Posted: Sun Nov 25, 2012 4:16 pm
by BullBear52x
Thanks everyone, one more nerdy analog, lets see if we are here where I circled on chart. a pull back from this instant high or Monday high whichever it maybe.
IFa pull back is more than 50% fib retracement, bullish view will be redraw if not cancel all together. lets see what the Santa will bring. jingle jingle bell
Re: 11/24/2012 Weekend Update
Posted: Sun Nov 25, 2012 5:46 pm
by ClarkW
Great charts everybody!
Re: 11/24/2012 Weekend Update
Posted: Sun Nov 25, 2012 7:49 pm
by daytradingES
Al_Dente wrote:daytradingES wrote:Hi Al,
Looking at the chart you posted it doesn't look like cumulative Tick is not effective for intraday turns, is that what you see?
Below is the tick and price
Hi dtes
that one is regular tick not cumulative
i like watching regular tick on 1min and 5min just for scalping intraday, as it can confirm/deny an intraday move...
GL2u
hi Al,
Yes I know its not cumulative. (perhaps I confused things by posting it?)
my question was/is:
It doesn't seem the cumulative chart you posted is helpful on intraday turns.
Is that also what you see?
Your cumulative chart covers many days.
Perhaps you use something different for intraday?
Re: 11/24/2012 Weekend Update
Posted: Sun Nov 25, 2012 8:05 pm
by ClarkW
Is the carry trade due for a pullback? Implications on market?
Re: 11/24/2012 Weekend Update
Posted: Sun Nov 25, 2012 8:38 pm
by bearing
Al_Dente wrote:
Thanks cobra
I’m watching essesseme’s INTRADAY cumulative tick to see how quickly it responds to an intraday turn… we’ll see
1124wkndtick.png
I've seen a trading system with intra-day cumulative ticks a while back that uses a number of panes.
From memory:
Pane 1: Intra-day Cumulative Tick with 50 period ma
Pane 2: TLT with 50 period ma
Pane 3: Vix with 50 period ma
Pane 4: Spy with 50 period ma
When all four cross the 50 period ma that signals a buy signal (spy and tick over 50ma and TLT and and vix below 50ma) or vice versa for a sell signal. If you or someone plots it out I would love to see it.
Re: 11/24/2012 Weekend Update
Posted: Sun Nov 25, 2012 8:40 pm
by daytradingES
We're going DOWN
Here is a little video I made to give an alternate view to the bulls.
http://screencast.com/t/NyL8xoxw
Several days ago I posted
"they can ramp it up 60 pts any time they like"
and then later
"you watch a sharp rally and all the baby bears will get scared."
(Picture re-included for my friend Al! -too cute to not include!!)
If I was only looking
at points of swings I might agree with WT. Of 90.50 down 67.25 corrected since last Friday's low, though we haven't yet br0ken the downtrend line or resistance (see chart attached)
However, and this is the point of the video
"time rules"
Gann has a rule that time over-balances price. That is when the time is up the trend has changed.
He also continues this with measuring swings in time.
When the last swing down in time exceeds the last swing down on the way up to the peak the trend has changed to down.
(He would say something like, "You have a clear definite indication that the trend has changed if confirmed by my other rules."

)
So with great clarity:
We are going
DOWN!!!!!!!!!
The trend is still DOWN !!!!!!!!!!!!
NTA
IHIH
GLTA
Re: 11/24/2012 Weekend Update
Posted: Sun Nov 25, 2012 9:17 pm
by Al_Dente
PAGING ANYONE PARTICIPATING IN THE “CYBER-MONDAY” special offer from stockcharts.com
If you accept this deal, be sure to read EVERYTHING on checkout
eg: they were advertising an extra few months free, then at checkout, it did not appear correctly
Stockcharts replied to me just now:
“””Thank you for sending us your message about our CyberMonday special.
I apologize for the confusion. There was a glitch in the system, and it was not displaying the correct information.
If you place your order now, you should see the CyberMonday deal reflected in the pricing”””
Just sayin’….. double check it….