Page 4 of 4
Re: 02/16/2013 Weekend Update
Posted: Tue Feb 19, 2013 12:47 am
by TraderGirl
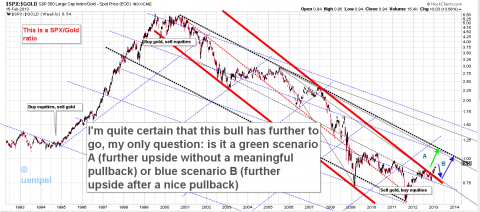
uempel wrote:Two possible scenarios for the next few weeks, check out this SPX/Gold chart. First green scenario is bullish equities and further weakness in gold/treasuries, blue second scenario is sideways move/decline equities and sideways move/strength in gold/treasuries. Medium term/long term both scenarios are bullish equities and bearish for gold/treasuries.
By the way, this is one of my most cherished charts

The attachment 76.png is no longer available
Hi uempel...
Can't say I know where the price of Gold is headed....but it seems to be moving independently from treasuries and coming upon important support...
Treasuries have been moving counter trend to equities...and Gold has taken a life of it's own...blue arrows indicate when treasuries and GLD has moved countertrend as you can see on my very messy and crudely drawn chart (not as fancy and pretty as yours
)
I suppose when we get a large correction in the coming months, Gold could be considered a risk asset as in 2008/2009 and sell off with the market at some point while treasuries move countertrend to SPX....
In the next few weeks if it has any chance of heading higher...looks like support must hold because this will be the 3rd attempt at this support level...
Re: 02/16/2013 Weekend Update
Posted: Tue Feb 19, 2013 12:59 am
by TWT
EURUSD: The correct labelling of potential triangle will dictate over the st equity trend
Re: 02/16/2013 Weekend Update
Posted: Tue Feb 19, 2013 1:27 am
by TWT
$JY_F (JPY): Last thrust down ?
Re: 02/16/2013 Weekend Update
Posted: Tue Feb 19, 2013 5:32 am
by uempel
Thanks TraderLady, I only see that equities are so much stronger than treasuries or gold

Of coure these are long term charts which don't care about pullbacks, but they do show that it's riskier to short equities than to play the long side

30-Year Treasury/SPX
Gold/SPX
TraderGirl wrote:uempel wrote:Two possible scenarios for the next few weeks, check out this SPX/Gold chart. First green scenario is bullish equities and further weakness in gold/treasuries, blue second scenario is sideways move/decline equities and sideways move/strength in gold/treasuries. Medium term/long term both scenarios are bullish equities and bearish for gold/treasuries.
By the way, this is one of my most cherished charts
The attachment 76.png is no longer available
Hi uempel...
Can't say I know where the price of Gold is headed....but it seems to be moving independently from treasuries and coming upon important support...
Treasuries have been moving counter trend to equities...and Gold has taken a life of it's own...blue arrows indicate when treasuries and GLD has moved countertrend as you can see on my very messy and crudely drawn chart (not as fancy and pretty as yours
)
I suppose when we get a large correction in the coming months, Gold could be considered a risk asset as in 2008/2009 and sell off with the market at some point while treasuries move countertrend to SPX....
In the next few weeks if it has any chance of heading higher...looks like support must hold because this will be the 3rd attempt at this support level...
Re: 02/16/2013 Weekend Update
Posted: Tue Feb 19, 2013 6:37 am
by TWT
$DX_F (USD Index): $ Bulls/Equity Bears need an impulsive up leg
Re: 02/16/2013 Weekend Update
Posted: Tue Feb 19, 2013 7:41 am
by TWT
$GDX: Maybe in the last Zig Zag