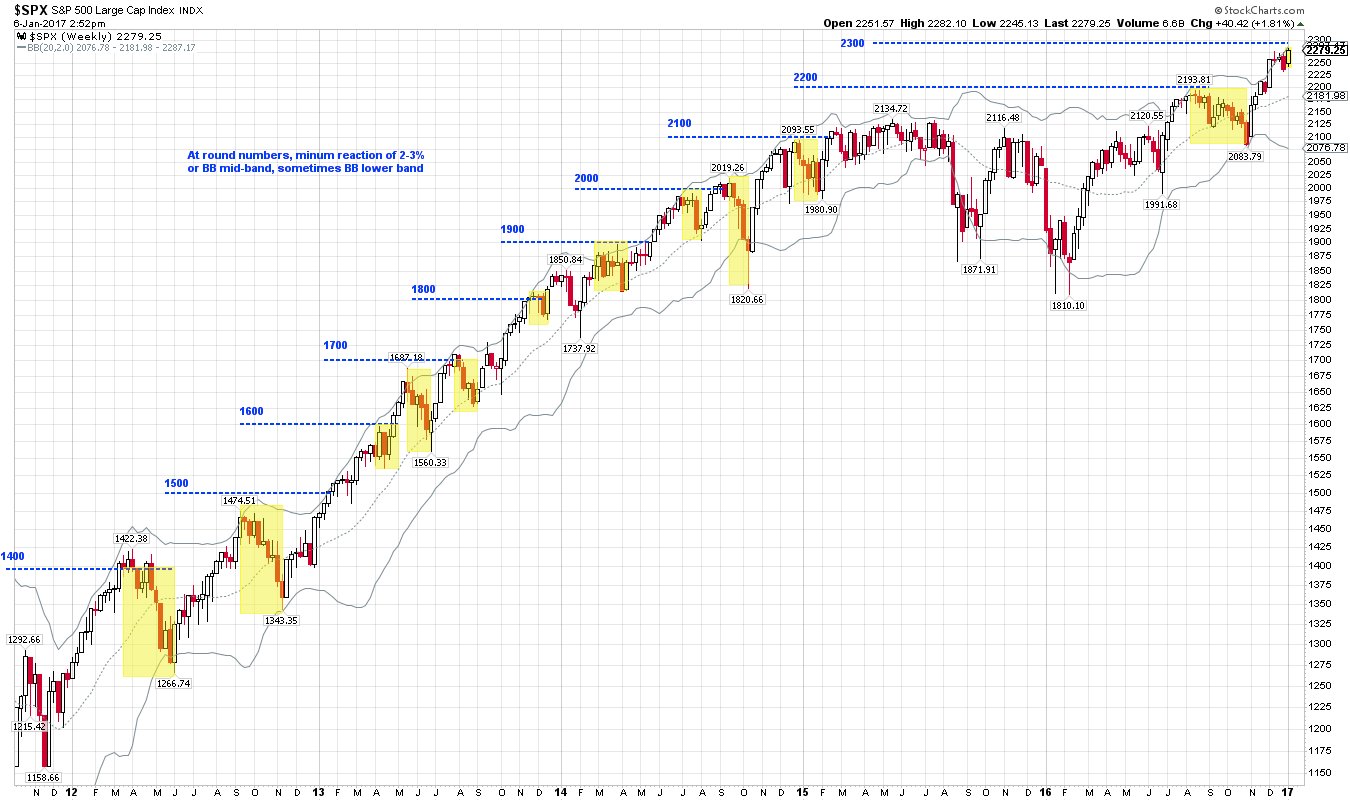
Urban Camel tweeted this morning a big history chart. Bollinger shows we should be hitting a pull back. I would point out that outside of the Swiss National Bank (largest holder of Facebook) ECB and buybacks seem to be the main source of cash. Buybacks about to be shut off for earnings and ECB is about to taper (so it is claimed). All aligns with typical new president running out of fairy dust. But who knows, maybe Trump will go way beyond the Dot com and 1929 valuation records.
Trades with cats wrote:Urban Camel tweeted this morning a big history chart. Bollinger shows we should be hitting a pull back. I would point out that outside of the Swiss National Bank (largest holder of Facebook) ECB and buybacks seem to be the main source of cash. Buybacks about to be shut off for earnings and ECB is about to taper (so it is claimed). All aligns with typical new president running out of fairy dust. But who knows, maybe Trump will go way beyond the Dot com and 1929 valuation records.
thanks boss
your charts often cut off the right-hand side (the current stuff)
better to add link? https://twitter.com/@ukarlewitz
Disclaimer: I am not an investment advisor. This is just my opinion NOT investment advice.
Trades with cats wrote:Urban Camel tweeted this morning a big history chart. Bollinger shows we should be hitting a pull back. I would point out that outside of the Swiss National Bank (largest holder of Facebook) ECB and buybacks seem to be the main source of cash. Buybacks about to be shut off for earnings and ECB is about to taper (so it is claimed). All aligns with typical new president running out of fairy dust. But who knows, maybe Trump will go way beyond the Dot com and 1929 valuation records.
Your long term chart looks like it could set up into a perfect dome. We will just have to wait and see.
fehro wrote:"IF" SPX can't fill morning gap ...looking to Jan 3rd gap fill to 2248 with green 60m bull flag support near 20d SMA at 2260 key level today
chopping around trying to fill the gap.. VIX backs off.
Big charts imported from other sources seem to need a zoom adjustment down to 80% or so to see the whole thing. I will include a link as I am already pasting it anyway. I thought his view that even numbers frequently lead to pull backs was interesting. What I would prefer to see is that composite of world wide central bank money creation on the same scale.
Trades with cats wrote:Urban Camel tweeted this morning a big history chart. Bollinger shows we should be hitting a pull back. I would point out that outside of the Swiss National Bank (largest holder of Facebook) ECB and buybacks seem to be the main source of cash. Buybacks about to be shut off for earnings and ECB is about to taper (so it is claimed). All aligns with typical new president running out of fairy dust. But who knows, maybe Trump will go way beyond the Dot com and 1929 valuation records.
thanks boss
your charts often cut off the right-hand side (the current stuff)
better to add link? https://twitter.com/@ukarlewitz
Right mouse click ======> open the image in new tap (Chrome)
will open up the whole image.
My comments are for entertainment/educational purpose only. NOT a trade advice.
BullBear52x wrote:Right mouse click ======> open the image in new tap (Chrome)
will open up the whole image.
THANKS BOSS that works 4 me
ELSEWHERE:
Zoom on IWM daily
Right there testing all the bottom lines
BUT sell-volume has dissipated in the last three days (three days of price down, three days of reduced selling volume). That’s bullish
BUT MUST SEE END OF DAY VOLUME. If selling volume is truly drying up, then Oy
To paraphrase Al Brooks: It’s not a breakdown until it breaks down
Disclaimer: I am not an investment advisor. This is just my opinion NOT investment advice.
Trades with cats wrote:Urban Camel tweeted this morning a big history chart. Bollinger shows we should be hitting a pull back. I would point out that outside of the Swiss National Bank (largest holder of Facebook) ECB and buybacks seem to be the main source of cash. Buybacks about to be shut off for earnings and ECB is about to taper (so it is claimed). All aligns with typical new president running out of fairy dust. But who knows, maybe Trump will go way beyond the Dot com and 1929 valuation records.
thanks boss
your charts often cut off the right-hand side (the current stuff)
better to add link? https://twitter.com/@ukarlewitz
ELSEWHERE:
Zoom on IWM daily
Right there testing all the bottom lines
BUT sell-volume has dissipated in the last three days (three days of price down, three days of reduced selling volume). That’s bullish
BUT MUST SEE END OF DAY VOLUME. If selling volume is truly drying up, then Oy
To paraphrase Al Brooks: It’s not a breakdown until it breaks down
The attachment 19day.png.png is no longer available
A shakeout could be very deep to stay sober
Attachments
My comments are for entertainment/educational purpose only. NOT a trade advice.