Page 1 of 2
05/18/2017 Live Update
Posted: Thu May 18, 2017 9:22 am
by Cobra
If you're StockCharts member, please do me a little favor by "vote" and the most importantly "follow" my public chart list HERE. You need "follow" only once but vote can be done everyday, so whenever you have time, please vote for me, thanks! If you're not StockCharts member, you can also help boosting my rank by clicking the link once everyday.
- Please, again, all my calls in the daily live update is for intra-day only, they're absolutely invalid when the closing bell rings. If you're interested in the forecast for days and weeks, Please subscribe my Daily Market Report.
- Personal attack on any board members won't be tolerated. Please limit your topic to trade related only.
- Please no direct link to your personal web site or blog. You must post rich contents here. You can, however, put link to your personal web site or blog as your signature.
- I'm very busy during the trading hour, so your question posted on board might not be answered. For a guaranteed answer to your question please send email to info@cobrasmarketview.com.
========================================================================================================================================================================
maybe the rebound would fail?
Re: 05/18/2017 Live Update
Posted: Thu May 18, 2017 9:27 am
by Cobra
Re: 05/18/2017 Live Update
Posted: Thu May 18, 2017 9:37 am
by daytradingES
Cobra wrote:
maybe the rebound would fail?
Yes but where will it bounce to first? 67.50?
73.50
79?
(ES values)
Re: 05/18/2017 Live Update
Posted: Thu May 18, 2017 9:37 am
by uempel
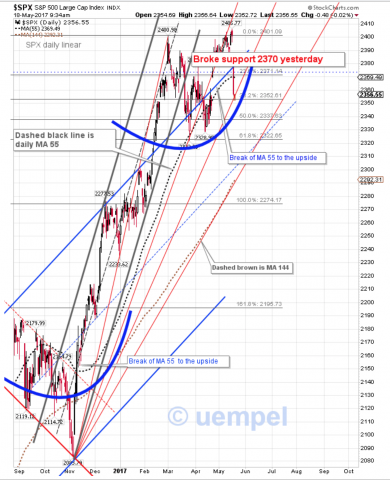
SPX bounced on support 2352ish in early trading, but the break of 2370 yesterday is a more important benchmark.

- SPX daily linear
Re: 05/18/2017 Live Update
Posted: Thu May 18, 2017 9:49 am
by fehro
SPX support holds - ish .. 60m/D - mind the 50d yellow bottom chart - mind the open gap lower
Re: 05/18/2017 Live Update
Posted: Thu May 18, 2017 10:00 am
by Cobra
Re: 05/18/2017 Live Update
Posted: Thu May 18, 2017 10:18 am
by daytradingES
if LOD in place and no inflection I have 2373.25 area as est HOD
Re: 05/18/2017 Live Update
Posted: Thu May 18, 2017 10:21 am
by uempel
I'm curious as to SPX bouncing back from 2352. Will the index get back/close above 2370 again?
uempel wrote:SPX bounced on support 2352ish in early trading, but the break of 2370 yesterday is a more important benchmark.
The attachment kjkj.png is no longer available
Re: 05/18/2017 Live Update
Posted: Thu May 18, 2017 10:38 am
by fehro
fehro wrote:SPX support holds - ish .. 60m/D - mind the 50d yellow bottom chart - mind the open gap lower
almost at 50d .. ding ding 1 point short

Re: 05/18/2017 Live Update
Posted: Thu May 18, 2017 11:24 am
by Cobra
kind of bull flag, bias is up.
Re: 05/18/2017 Live Update
Posted: Thu May 18, 2017 12:10 pm
by Cobra
Re: 05/18/2017 Live Update
Posted: Thu May 18, 2017 12:21 pm
by Al_Dente
poor CSCO down -7.8%, following eps report last night
it's only 1.1% of the dow, but dragging on it
(WMT is weighted at 2.5% of the dow, up following eps)
Re: 05/18/2017 Live Update
Posted: Thu May 18, 2017 12:36 pm
by Al_Dente
first potential higher low
and i believe that's where the longs will place their stops (pink)
Re: 05/18/2017 Live Update
Posted: Thu May 18, 2017 1:02 pm
by Cobra
near the end of a triangle, don't know direction.
Re: 05/18/2017 Live Update
Posted: Thu May 18, 2017 1:11 pm
by Al_Dente
Banks suck but note a few potential double (triple) bottoms here
Zoom in on GS, the heaviest guy in the dow.
The last time price was at yesterday’s level there was much more red selling volume, hence some kind of interim bottom is possible here.
The “classic bottom” volume formation would be another day(s) of lower price accompanied by reduced red selling volume. That would be the “””perfect””” bottom……. theoretically....
Re: 05/18/2017 Live Update
Posted: Thu May 18, 2017 1:22 pm
by QED
Al_Dente wrote:Zoom in on GS, the heaviest guy in the dow.
The last time price was at yesterday’s level there was much more red selling volume, hence some kind of interim bottom is possible here.
The “classic bottom” volume formation would be another day(s) of lower price accompanied by reduced red selling volume. That would be the “””perfect””” bottom……. theoretically....
518gs.png.png
Seasonality favors Goldman Sachs in February, July and October thru December.
Re: 05/18/2017 Live Update
Posted: Thu May 18, 2017 1:35 pm
by Al_Dente
QED wrote:Seasonality favors Goldman Sachs in February, July and October thru December.

Re: 05/18/2017 Live Update
Posted: Thu May 18, 2017 1:41 pm
by QED
CandleVolume: Look for wide hollow boxes at the bottom of a stock's trading range. Those days, in particular, not only show where demand is meeting supply, but if the candle
is "hollow" (white) you can quickly see a reversal taking place where the sellers have run out of volume to dump and buyers are coming in big. This is a great buy signal.
Re: 05/18/2017 Live Update
Posted: Thu May 18, 2017 2:08 pm
by Cobra
this bull shall have legs.
Re: 05/18/2017 Live Update
Posted: Thu May 18, 2017 2:14 pm
by fehro
fehro wrote:fehro wrote:SPX support holds - ish .. 60m/D - mind the 50d yellow bottom chart - mind the open gap lower
almost at 50d .. ding ding 1 point short

now ding ding..

possible resistance here… 50d 2369.30 key for the close.