Back to www.cobrasmarketview.com

07/08/2023 Weekend Update

Post Reply
User avatar
Cobra
Site Admin
Posts: 58679
Joined: Sat Feb 12, 2011 10:29 pm

07/08/2023 Weekend Update

Post by Cobra »

Down 1 week, the next week has 60% chances to close up.
4.png

Like to read more of my commentaries? Please subscribe my Daily Market Report.
Subscribers can find all the members only posts HERE.
StockCharts members, please vote for me HERE, thanks.
tsf
Posts: 535
Joined: Tue Feb 15, 2011 7:49 am

Re: 07/08/2023 Weekend Update

Post by tsf »

Trading Calendar

Results support belief in three calendar-related phases for U.S. stock market returns, with the index tending to:
●Rise for roughly the first third of the year.
●Flatten for roughly the next six months.
●Lift off for the last two months of the year.

For charts and more info:
https://www.cxoadvisory.com/trading-calendar/
User avatar
JFR
Posts: 10179
Joined: Sun Dec 02, 2012 7:24 pm

Re: 07/08/2023 Weekend Update

Post by JFR »

Positives:
EMAs bullish.
Trend up on the EMA 20.
Bullish move up in March and again in June.

Negatives:
Double top.
Pullback.
MACD and Histogram down.
Sto down.

Neutral:
Two dojis in a row.
Bollinger flat.
Volume light.

Conclusions:
Big picture still bullish. Need a bounce back up. Heavy resistance overhead now at 444. The market is having difficulty making up its mind (two dojis). No position for swing trades on SPY, ES and the like. Daytrading only for this trader.

Screenshot_20230708_000456.jpg
Charts posted are not recommendations. They are just a sharing of information.
tsf
Posts: 535
Joined: Tue Feb 15, 2011 7:49 am

Re: 07/08/2023 Weekend Update

Post by tsf »

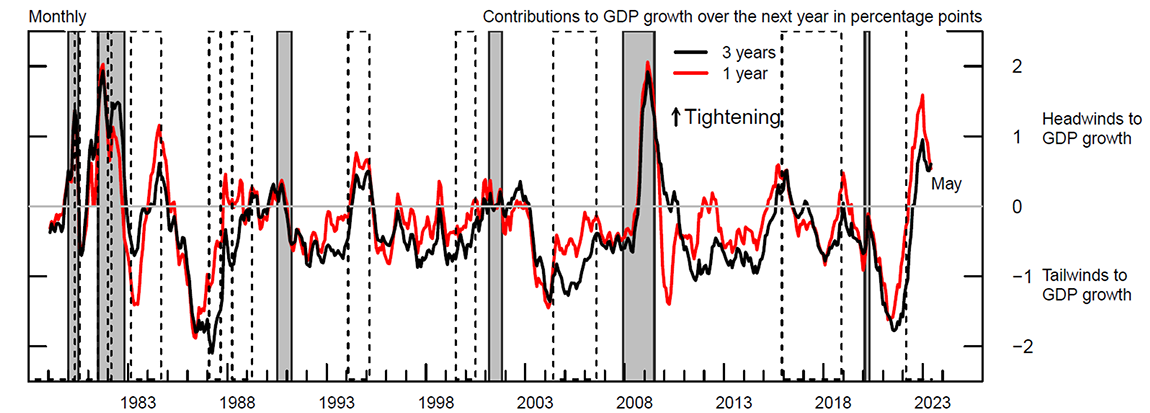
FEDS Notes
June 30, 2023
A New Index to Measure U.S. Financial Conditions
https://www.federalreserve.gov/econres/ ... 30630.html
https://www.federalreserve.gov/econres/ ... 281new.png
Image
tsf
Posts: 535
Joined: Tue Feb 15, 2011 7:49 am

Re: 07/08/2023 Weekend Update

Post by tsf »

Finding meaning in the Fed’s new financial index
JULY 5 2023

... this is a main Fed-designed (and implicitly blessed) FCI, while the others were invented by regional banks. So it could plausibly have implications for monetary policy.

For more market-relevant dissemination on what is new and different with Goldman Sachs and the Fed’s own FCI, please refer to:
https://www.ft.com/content/b4ae5c43-32f ... 0a8640dfac
te_fern
Posts: 4019
Joined: Tue Nov 24, 2015 3:35 pm

Re: 07/08/2023 Weekend Update

Post by te_fern »

Over the weekend, please take a little time to vote for Cobra, thanks: https://stockcharts.com/public/1684859/ ... /533449377
This is not investment or trade advice.
merryme
Posts: 561
Joined: Tue Apr 01, 2014 1:41 pm

Re: 07/08/2023 Weekend Update

Post by merryme »

Hourly P&F user defined chart 3 x .84
Look at that cup and handle pattern. New structure just starting out. I am guessing it will be a re-accumulation with a few fear flushes to scare folks. Interesting to me is the volume noted by red bars and green arrows. Big push down on first red bar and upside volume makes a new high. Smaller red volume pushes down for the double bottom and ALMOST THE SAME VOLUME makes the new high. To my thinking, that's big money coming in at their buy zone.
Attachments
Screenshot (1717).png
Sharing research and ideas only, this is not trading advice.
“If people concentrated on the really important things in life, there’d be a shortage of fishing poles.” – Doug Larson
merryme
Posts: 561
Joined: Tue Apr 01, 2014 1:41 pm

Re: 07/08/2023 Weekend Update

Post by merryme »

Just showing bullishness....
Attachments
Screenshot (1713).png
Sharing research and ideas only, this is not trading advice.
“If people concentrated on the really important things in life, there’d be a shortage of fishing poles.” – Doug Larson
merryme
Posts: 561
Joined: Tue Apr 01, 2014 1:41 pm

Re: 07/08/2023 Weekend Update

Post by merryme »

Old P&F chart ATR=14.34. I have shown this chart before. Just for fun chart to look back and see what has happened. Only ONE SEVEN shown on chart. June = 6 shows we have closed higher than any other June. It's a long-term view.
Attachments
Screenshot (1715).png
Sharing research and ideas only, this is not trading advice.
“If people concentrated on the really important things in life, there’d be a shortage of fishing poles.” – Doug Larson
User avatar
Al_Dente
Posts: 28535
Joined: Thu Jul 21, 2011 2:29 pm

Re: 07/08/2023 Weekend Update

Post by Al_Dente »

ROUNDUP from Friday, except where another date is noted:
[Spot Gamma:] The key takeaway from this past holiday shortened week was:
put demand cratered ...despite that volatility spike on Thursday AM and the large reversal yesterday [Friday].

[Jesse Felder referencing Tom McClellan]
'Right now, the message is that the higher highs being made by the SP500 here happening without strong liquidity, in other words this is just coming from optimism and not from money. That is a problematic way to run an uptrend.'

[Thomas Thornton, the guy who counts DeMark numbers]
"The $SPX may get the DeMark Sequential on day 12 of 13 on Monday and possibly sell Countdown 13 on Tuesday. The last sell Countdown 13 was on 12/13/22, also a CPI day.

[Ned Davis Research]:
“Ned Davis Research said on Wednesday (6/28/23) that a Fed-induced recession is the most likely risk that could derail stocks. ‘If the Fed panics and cuts rates, a blow-off bubble peak would be possible..."

[Callum Thomas]:
See "... how far and fast sentiment has shifted from deep pessimism to now outright optimism.
... how much longer can global equity markets defy the monetary gravity.
... if yields push further higher having broken back above the 4% level, it could rattle investors’ newfound optimism.
FROM LAST WEEK, 6/2/23
if we look at the percentage of Nasdaq stocks with negative earnings, it has just reached a new all-time high. If you argue that it is a fundamental driven rally, it ain’t showing up in the numbers (at least not yet?).
https://www.chartstorm.info/p/weekly-s- ... orm-9-july

[Lance Roberts]:
Last week he was bullish with a "potential for a 5-10% correction".
This week: "the market remains short-term overbought... but we remain bullishly positioned near term..." [but hedging for the eventual correction]
And "The US tech sector... looks simply nuts..."
And he opines on Q2 Earnings Season
https://realinvestmentadvice.com/q2-ear ... the-bulls/

[David Rosenberg; Rosie]
"When you take into account (i) back revisions, (ii) multiple-job holders and (iii) the Birth-Death model, nonfarm payrolls actually contracted in June. The recession has not been averted or avoided. The Fed will figure it out at some point but it will be too late.

[Ryan Detrick]:
"... we think strong performance can continue."
... Good chance the 209k [jobs numbers] gets revised higher.
* 1.7 millions jobs created in 2023, on the heels of the record 4.8 million last year ==> this doesn't look like a recession
"Be aware that stocks relative to bonds made another new all-time high this week. No one knows when this will stop, but until it does, OW [overweght] stocks makes a lot of sense
Disclaimer: I am not an investment advisor. This is just my opinion NOT investment advice.
User avatar
BullBear52x
Posts: 29648
Joined: Tue Feb 22, 2011 3:47 pm

Re: 07/08/2023 Weekend Update

Post by BullBear52x »

From "It is what it is department" Topping signs all over the places but internals are not quite agreed, need to see new LL to say bears are back in town.
2.PNG
Channels side of thing.
1.PNG
Swing set up: this dip will be bought, Buy/Sell until it fails, it is more bearish leaning under 5 DMA but bulls have one buy coupon left on this setup.
3.PNG
Intraday: Friday closed with a negative price action. down Friday the weakness should continue into Monday. Trade well, Peace!
4.PNG
My comments are for entertainment/educational purpose only. NOT a trade advice.
Post Reply