[SENTIMENT TRADER, yesterday]
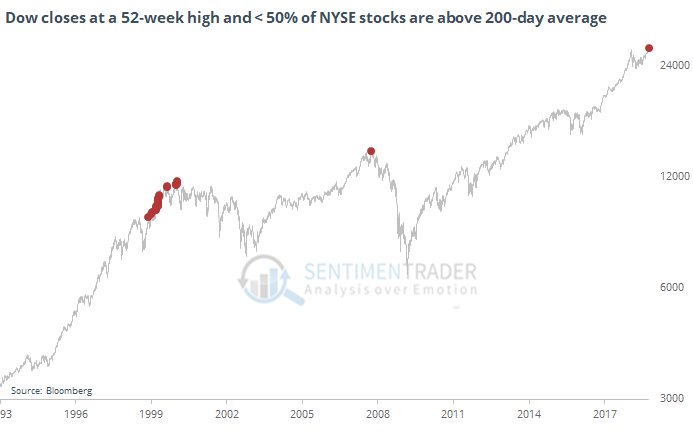
“Here is every time in the past 25 years when the Dow closed at a 52-week high while most of the NYSE was in a bear market.” https://pbs.twimg.com/media/DoldI4AU4AAKXhG.jpg
Disclaimer: I am not an investment advisor. This is just my opinion NOT investment advice.
the rebound still has chances to fail. wait and see.
Attachments
Like to read more of my commentaries? Please subscribe my Daily Market Report. Subscribers can find all the members only posts HERE. StockCharts members, please vote for me HERE, thanks.
Like to read more of my commentaries? Please subscribe my Daily Market Report. Subscribers can find all the members only posts HERE. StockCharts members, please vote for me HERE, thanks.
Harry at Lizard Indicators has put out a multi-deviation tool. I have stumbled into the setting on the chart, the dark dot lines. So using the error calculation from linear regression for 10 prior bars on the EMA plus and minus 2 times really does a good job of containing price. It also helps with my trend lines which you all know could use some help! I don't know if stock charts will let you do some sort of Bollinger off of the EMA but if they do you should play with it.


