Page 6 of 8
Re: 09/04/2013 Live Update
Posted: Wed Sep 04, 2013 2:19 pm
by uempel
uempel wrote:Close-up:
69.png
2 min later: the red line was crossed

Re: 09/04/2013 Live Update
Posted: Wed Sep 04, 2013 2:21 pm
by BullBear52x
AAPL is approaching its first sell the rip spot, but look at the power that be try to control the RSI, Hmm...a spike up to top wedge line might be what's in her mind?
Re: 09/04/2013 Live Update
Posted: Wed Sep 04, 2013 2:24 pm
by uempel
uempel wrote:uempel wrote:Close-up:
69.png
2 min later: the red line was crossed

7 min later: bear trap

Re: 09/04/2013 Live Update
Posted: Wed Sep 04, 2013 2:27 pm
by Cobra
Re: 09/04/2013 Live Update
Posted: Wed Sep 04, 2013 2:28 pm
by BullBear52x
Here is my last sell if there is no new low for SPX. SWING (over night not intraday)
Posted: Wed Sep 04, 2013 2:29 pm
by MrMiyagi
nightwolf wrote:What now Mr. Miyagi...Any new P-bars showing up?
Not yet. Generally the price should take a break which it may already have. Also, NYMO is very close to the upper Bollinger bands and could be signaling for a reversal. NYMO reversals, up or down, are not defined in size or time.
Re: 09/04/2013 Live Update
Posted: Wed Sep 04, 2013 2:30 pm
by L_T
Al_Dente wrote:L_T wrote:Latest red bar says get short (intraday).
boss do u have a quickie explanation of “volatility stop” dots
Here is from freestockcharts.com:
Volatility Stop
The Volatility Stop Indicator helps define the current trend. The indicator plots a red line above the prices bars when a downward trend is detected, and a blue line below the bars when an upward trend is detected. These lines are commonly used as trailing stops.
For my part I find they "just work"
most of the time. When they line up with moving averages, lower lows/higher highs, etc. it makes for a stronger signal whatever way things are going. I'm sure with some Googling you could find the exact calculation and that would explain things better than I can.
Re: 09/04/2013 Live Update
Posted: Wed Sep 04, 2013 2:35 pm
by uempel
Re: 09/04/2013 Live Update
Posted: Wed Sep 04, 2013 2:39 pm
by BullBear52x
TLT enter consolidation phase.
Re: 09/04/2013 Live Update
Posted: Wed Sep 04, 2013 2:39 pm
by jack black
Interesting find on war vs markets:
Oil up/equities down just before war and reversal as soon as war starts.
Weird!
http://money.cnn.com/2013/09/03/investi ... index.html
Re: 09/04/2013 Live Update
Posted: Wed Sep 04, 2013 2:45 pm
by BullBear52x
UUP bullish break out.
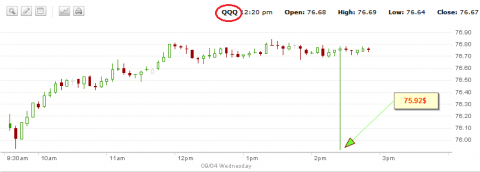
Posted: Wed Sep 04, 2013 2:51 pm
by MrMiyagi

- QQQ
Re: 09/04/2013 Live Update
Posted: Wed Sep 04, 2013 2:54 pm
by Richarab
can we start twerking yet...i feel it coming on....
Re: 09/04/2013 Live Update
Posted: Wed Sep 04, 2013 2:55 pm
by Al_Dente
thanks L_T

Re: 09/04/2013 Live Update
Posted: Wed Sep 04, 2013 2:55 pm
by Daniel-David
UUP very bullish past weeks, above the upslope 5 and 10day MAs, closed above 50day MA for first time in a long while... but also closed outside its bollinger-band. Today is back under the 50day... may need some cooling off before it gets mojo to wander aggressively higher, esp. with the dollar/yen cross bearing so many crosscurrents.
Re: 09/04/2013 Live Update
Posted: Wed Sep 04, 2013 2:57 pm
by BullBear52x
Another sell triggered on FAS
Re: 09/04/2013 Live Update
Posted: Wed Sep 04, 2013 2:58 pm
by fehro
Two for Two?
Posted: Wed Sep 04, 2013 3:02 pm
by MrMiyagi
!!!!! POWER HOUR !!!!!
Re: Two for Two?
Posted: Wed Sep 04, 2013 3:07 pm
by 1der
MrMiyagi wrote:!!!!! POWER HOUR !!!!!
That scared the crap out of me!
I refreshed the page and BAMMM ! That POWER HOUR was huge!
Hope it did not scare the bulls


Re: 09/04/2013 Live Update
Posted: Wed Sep 04, 2013 3:09 pm
by fehro
SPX 5m .. minor bull flag... or expanding triangle?.. messy..