no, i save my layouts depending on what portfolio i might be looking at the symbol for...example, "high dividend" is a layout of all the stocks i'm looking at for my high dividend portfolio. however, let's say i want to chart "T" for the first time, but i know that i use the same 5 moving averages, rsi, macd, and volume to start out any chart analysis, i have to do all of that manually...instead of it being saved as some sort of set i can overlay onto any new chart in one button.
jarbo456 wrote:anyone here using freestockcharts.com know if there's a way of saving a "study set" like there is on the TOS charts?...starting to get old having to individually put up the same studies over and over and over again every time i open a new symbol to chart.
describe "study set"
my 5 standard moving averages i put on every chart...volume at price, RSI, and MACD settings...
instead of having to add each component to the chart...on TOS you can save the "study set" so that you can just upload it to any chart you open.
Yea, dang, wish I could help
Every chart I create I have to reinvent wheel
Hate it… one of a few downsides 2 freestockcharts
There must be a way that we don’t know about
I’ve been searching for something like “create chart based on that last one” or SOMETHING…..
Yes, you can, Al. once you put all the desired indicators on a charts and fine-tuned then, you can just use the "save indicators" selection in pull-down menu, and give it a name. this will save all the setup you have as a "compound indicator". next time you need it, just select it in the add-indicator menu. the ones you saved will show up at the start of the menu
no, i save my layouts depending on what portfolio i might be looking at the symbol for...example, "high dividend" is a layout of all the stocks i'm looking at for my high dividend portfolio. however, let's say i want to chart "T" for the first time, but i know that i use the same 5 moving averages, rsi, macd, and volume to start out any chart analysis, i have to do all of that manually...instead of it being saved as some sort of set i can overlay onto any new chart in one button.
that's all. thanks for the input guys...[/quote]
That is precisely what I use layouts for. Set up a chart the way you like it. Save a new layout. Now open any other symbol, and your indicators are there.
jarbo456 wrote:anyone here using freestockcharts.com know if there's a way of saving a "study set" like there is on the TOS charts?...starting to get old having to individually put up the same studies over and over and over again every time i open a new symbol to chart.
describe "study set"
my 5 standard moving averages i put on every chart...volume at price, RSI, and MACD settings...
instead of having to add each component to the chart...on TOS you can save the "study set" so that you can just upload it to any chart you open.
Yea, dang, wish I could help
Every chart I create I have to reinvent wheel
Hate it… one of a few downsides 2 freestockcharts
There must be a way that we don’t know about
I’ve been searching for something like “create chart based on that last one” or SOMETHING…..
Yes, you can, Al. once you put all the desired indicators on a charts and fine-tuned then, you can just use the "save indicators" selection in pull-down menu, and give it a name. this will save all the setup you have as a "compound indicator". next time you need it, just select it in the add-indicator menu. the ones you saved will show up at the start of the menu
[email protected] wrote:Cobra:
Your $NATV:$NYTV is spiking intraday again. Over 2.8. Is it normal to spike intraday and settle lower?
Also, many indications of severe beta chasing here. Head long rush into small caps relative to large caps, for example: http://screencast.com/t/iVo6eAwB
Great chart. Cobra what's your take on this?
I said intraday doesn't count. let's wait until close.
Like to read more of my commentaries? Please subscribe my Daily Market Report. Subscribers can find all the members only posts HERE. StockCharts members, please vote for me HERE, thanks.
jarbo456 wrote:anyone here using freestockcharts.com know if there's a way of saving a "study set" like there is on the TOS charts?...starting to get old having to individually put up the same studies over and over and over again every time i open a new symbol to chart.
describe "study set"
my 5 standard moving averages i put on every chart...volume at price, RSI, and MACD settings...
instead of having to add each component to the chart...on TOS you can save the "study set" so that you can just upload it to any chart you open.
Yea, dang, wish I could help...Every chart I create I have to reinvent wheel...Hate it… one of a few downsides 2 freestockcharts
There must be a way that we don’t know about...I’ve been searching for something like “create chart based on that last one” or SOMETHING…..
Yes, you can, Al. once you put all the desired indicators on a charts and fine-tuned then, you can just use the "save indicators" selection in pull-down menu, and give it a name. this will save all the setup you have as a "compound indicator". next time you need it, just select it in the add-indicator menu. the ones you saved will show up at the start of the menu...
Hope this helps.
LEARNINGT
THAT IS EXACTLY WHAT I NEED
Where is the “save indicators” (which pull-down menu?)
Where is “add indicator” menu?
THANK U VERY MUCH
thanks quatzl
my problem isn’t with layouts...it is INSIDE A LAYOUT…creating a new chart via a new tab…. Have to start fm scratch...Appreciate yr help
Disclaimer: I am not an investment advisor. This is just my opinion NOT investment advice.
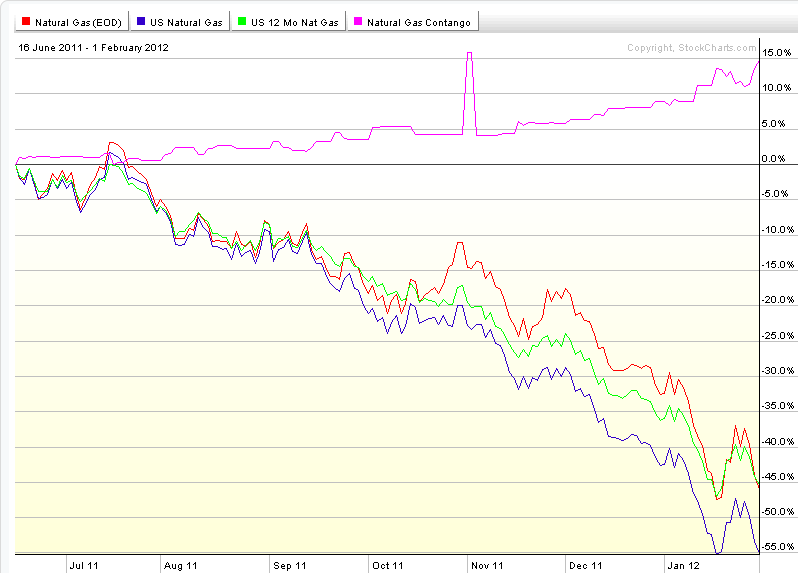
I see UNG traders here... just an FYI for you folks, UNG announced late yesterday that it will undergo a reverse 1-4 split following the market close on February 21.
BullTart wrote:I see UNG traders here... just an FYI for you folks, UNG announced late yesterday that it will undergo a reverse 1-4 split following the market close on February 21.
I guess that's bullish? You have an approximate upside target?