Page 11 of 11
Re: 08/14/2012 Live Update
Posted: Tue Aug 14, 2012 4:17 pm
by TraderGirl
victorm wrote:TraderGirl wrote:CognitiveDissonance wrote:TraderGirl wrote:/ES is back and forth between printing a solid green candle (sometimes reversal), and red candle... Turn tomorrow or Thursday. My more reliable chart says we are down into 17/20th then up again into 23/24th. Depending on the rally into the 23/24th would affect the potential sell-off we get after....IMHO..
A small rally could equal bigger selloff, and a large rally could equal small sell-off...??? we'll see..
Yes, thank you

The fact that the XIV is already turning down before the turn date, and the probability that we could be up into the 23/24th, and that my chart can shift a day or so, leads me to believe the turn will be up not down, possibly more like on Thursday....???? I just don't want to be bias either way...keeping possibilities open, because in this market, the pullbacks have been small so far, not expecting too much of a move down....
EdIt: not much of a down between now and 24th....
Thanks TG, got 11+% on UUU today.
did you short it?
Re: 08/14/2012 Live Update
Posted: Tue Aug 14, 2012 4:19 pm
by Mr. BachNut
Well, close but no cigar on the S&P future getting it's 8th daily up close in a row.

Re: 08/14/2012 Live Update
Posted: Tue Aug 14, 2012 4:35 pm
by TradingJackal
Al_Dente wrote:TradingJackal wrote:Al_Dente wrote:Lowest .....
Al, I have two Ticks at less than -1000. Two ticks separated in time on the same day signals a reversal of trend to me. I have seen the same earlier (but on the bullish side).
"""""""""Two ticks separated in time on the same day signals a reversal of trend to me.""""""
jackal can u elaborate on that? thx
TICK sank below -1000 thrice today - 11:40am, 2:35pm and 2:50pm CST. In an uptrend when TICK touched -1000, it used to be a signal to buy. Recently, I noticed that if you get it twice or more on the same day in the opposite side of the trend (assuming the trend is bullish here), it foretells of a reversal in the trend. This happened a few weeks ago when the trend was down but the TICK hit 1000+ twice in a day (separated by a few hours) and the trend reversed to upside from the next day. Might have to dig up some statistics (at least recent ones) to see if there are more data points. Maybe it is nothing as I happened to be home that day and today. I don't have access to TICK from my day job.
PS: Mr. Hyde has been bearish (successfully, I might add) and the mind set may have colored the comment so take it FWIW.
Re: 08/14/2012 Live Update
Posted: Tue Aug 14, 2012 4:50 pm
by TradingJackal
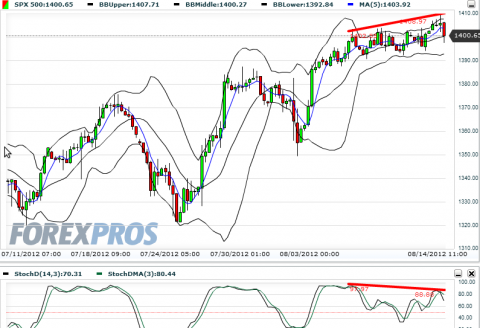
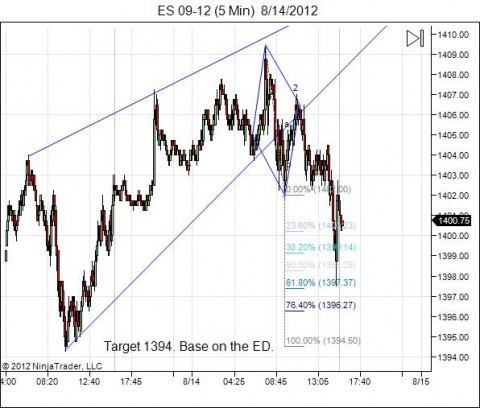
Divergence on 5Hour ES is money in the bank. Also, update from the Diamond Top pattern. The tape turns right at the 61.8 Fib! Maybe that is all we get, maybe we get the rest later. Per the literature at Bulkowski's the target was at 100% which is also the base of the ED/rising wedge with target at the bottom of the wedge.

- ES Divergence on 5 hr and Stoch turning over.

- Diamond Top on ES playing to 61.8 Fib so far. But the night is young.
Re: 08/14/2012 Live Update
Posted: Tue Aug 14, 2012 4:50 pm
by Harapa
Al_Dente wrote:Harapa wrote:Al_Dente wrote:blabla
VIX/RVX/VXO/VXN all in sell mode
so 168 had to go below zero line, right???
A Picture Is Worth One Thousand Words. Signal is when 9 EMA of 168 CCI crosses the zero line of 168 CCI as shown here for VXN. VXN was the last one to trigger the sell signal.
Re: 08/14/2012 Live Update
Posted: Tue Aug 14, 2012 5:10 pm
by Al_Dente
Harapa wrote:Al_Dente wrote:Harapa wrote:Al_Dente wrote:blabla
VIX/RVX/VXO/VXN all in sell mode
so 168 had to go below zero line, right???
A Picture Is Worth One Thousand Words. Signal is when 9 EMA of 168 CCI crosses the zero line of 168 CCI as shown here for VXN. VXN was the last one to trigger the sell signal.
EXCELLENT VISUAL that really helped thx v much

Re: 08/14/2012 Live Update
Posted: Tue Aug 14, 2012 5:14 pm
by Al_Dente
TradingJackal wrote:Al_Dente wrote:TradingJackal wrote:Al_Dente wrote:Lowest .....
Al, I have two Ticks at less than -1000. Two ticks separated in time on the same day signals a reversal of trend to me. I have seen the same earlier (but on the bullish side).
...jackal can u elaborate on that? thx
TICK sank below -1000 thrice today - 11:40am, 2:35pm and 2:50pm CST. In an uptrend when TICK touched -1000, it used to be a signal to buy. Recently, I noticed that if you get it twice or more on the same day in the opposite side of the trend (assuming the trend is bullish here), it foretells of a reversal in the trend. This happened a few weeks ago when the trend was down but the TICK hit 1000+ twice in a day (separated by a few hours) and the trend reversed to upside from the next day. Might have to dig up some statistics (at least recent ones) to see if there are more data points. Maybe it is nothing as I happened to be home that day and today. I don't have access to TICK from my day job.
PS: Mr. Hyde has been bearish (successfully, I might add) and the mind set may have colored the comment so take it FWIW.
Thanks jackal
When I watch tick 2min I use the “area” red and green feature
This ONLY catches the 2min closing ticks and misses the “intra-period” ticks
So I had to change my tick back to high/low/close to get the better picture...much better......thx
Re: 08/14/2012 Live Update
Posted: Tue Aug 14, 2012 5:36 pm
by Al_Dente
HARAPA r u still here?
Re: 08/14/2012 Live Update
Posted: Tue Aug 14, 2012 5:44 pm
by Harapa
Al_Dente wrote:HARAPA r u still here?
yes, I just sent you a PM
Re: 08/14/2012 Live Update
Posted: Tue Aug 14, 2012 5:49 pm
by Al_Dente
Harapa wrote:Al_Dente wrote:HARAPA r u still here?
yes, I just sent you a PM
THANKS TO YOU I just added CCI to my freestk XIV 5min
Note that if we just used ONLY xiv it would have been a sell at 12:15ish ET and hold short SPY the rest of the day.
I’m not trying to be lazy but could ONE indicator (this based on vol futures) work as well as six diff ones ??
http://screencast.com/t/Gy2B6BZc3R
i go now to pm THANKS AGAIN

Re: 08/14/2012 Live Update
Posted: Tue Aug 14, 2012 5:57 pm
by Harapa
Al_Dente wrote:Harapa wrote:Al_Dente wrote:HARAPA r u still here?
yes, I just sent you a PM
THANKS TO YOU I just added CCI to my freestk XIV 5min
Note that if we just used ONLY xiv it would have been a sell at 12:15ish ET and hold short SPY the rest of the day.
I’m not trying to be lazy but could ONE indicator (this based on vol futures) work as well as six diff ones ??
http://screencast.com/t/Gy2B6BZc3R
i go now to pm THANKS AGAIN

My initial research was using VIX only, but it resulted in 50% win/loss ratio even though strategy over all was profitable. I agree looking at 4 is excessive. VIX and price MA cross over should work fine (BTW, price ribbons on my chart does exactly that).
Have a good evening.
Re: 08/14/2012 Live Update
Posted: Tue Aug 14, 2012 8:14 pm
by xfradnex
Stealth Euro QE already on going.
http://www.telegraph.co.uk/finance/fina ... runch.html. How does Greece, in any real world, get 4 Billion at 4% ????????????????????????????????????????????????????????????????????? So Greece is covered for the debt shortfall we were watching for on the 16th. The Germans are not crying foul yet.
Re: 08/14/2012 Live Update
Posted: Tue Aug 14, 2012 11:01 pm
by TradingJackal
Looks like ES is in a tight parallel channel. 1396.25 is the bottom of this channel and will be a tell of further weakness. The bottom of the channel is also the 76.4 fib of the diamond top pattern. Looks like we are on target. If this bullish channel breaks downwards, I have been told the first target is the point where it began. I am off on vacation and will be back in a week. GLTA.