Back to www.cobrasmarketview.com

09/05/2015 Weekend Update

User avatar
Cobra
Site Admin
Posts: 60145
Joined: Sat Feb 12, 2011 10:29 pm

09/05/2015 Weekend Update

Post by Cobra »

Institutional buying and selling chart from stocktiming shows more distribution than accumulation.However, the distribution is falling while accumulation is rising, so institutions are buying the dips.
Attachments
1.png

Like to read more of my commentaries? Please subscribe my Daily Market Report.
Subscribers can find all the members only posts HERE.
StockCharts members, please vote for me HERE, thanks.
User avatar
Cobra
Site Admin
Posts: 60145
Joined: Sat Feb 12, 2011 10:29 pm

Re: 09/05/2015 Weekend Update

Post by Cobra »

Smart money keep buying, so it's case 2.), still pointing the low was in!!!???

Since there're some arguments about how to read the chart, so it's necessary for me to explain here how I use this chart:

I don't care what's the logic behind the chart. I found it works in the following two cases:

1.) When market up huge, if I see smart money huge short, best if new record short, then I know a short-term pullback is due soon.
2.) When market down, if I see smart money suddenly rises sharply from very negative value, then I know the pullback was over.

So I only use this chart for the above 2 cases. Besides those 2 cases, it means nothing to me. i.e. the absolute value of this chart means nothing to me, I only care if it rises sharply or drops sharply.
Attachments
2.png

Like to read more of my commentaries? Please subscribe my Daily Market Report.
Subscribers can find all the members only posts HERE.
StockCharts members, please vote for me HERE, thanks.
fehro
Posts: 22880
Joined: Fri Sep 02, 2011 2:06 pm

Re: 09/05/2015 Weekend Update

Post by fehro »

Weekly/Daily Candles.
Attachments
Daily
Daily
Weekly
Weekly
fehro
Posts: 22880
Joined: Fri Sep 02, 2011 2:06 pm

Re: 09/05/2015 Weekend Update

Post by fehro »

Industry Weekly %
Attachments
Screen Shot 2015-09-05 at 8.49.38 AM.png
fehro
Posts: 22880
Joined: Fri Sep 02, 2011 2:06 pm

Re: 09/05/2015 Weekend Update

Post by fehro »

Attachments
Screen Shot 2015-09-05 at 8.53.44 AM.png
fehro
Posts: 22880
Joined: Fri Sep 02, 2011 2:06 pm

Re: 09/05/2015 Weekend Update

Post by fehro »

2 Channels % Stocks 1+2 Channels <200d Weekly <40d Daily. Continues to slip deeper.
Attachments
Screen Shot 2015-09-05 at 9.04.51 AM.png
fehro
Posts: 22880
Joined: Fri Sep 02, 2011 2:06 pm

Re: 09/05/2015 Weekend Update

Post by fehro »

Yields
Attachments
Screen Shot 2015-09-05 at 9.11.34 AM.png
User avatar
BullBear52x
Posts: 30053
Joined: Tue Feb 22, 2011 3:47 pm

Re: 09/05/2015 Weekend Update

Post by BullBear52x »

Mid term Trend following we are in a bearish consolidation phase, That said, no trend and indecision on a very short term time frame. wait for range breakout.
1.PNG
Short term I see bearish continuation pattern with negative accm/dist, a trade below 5/20 DMA is very bearish here.
3.PNG
My comments are for entertainment/educational purpose only. NOT a trade advice.
User avatar
BullBear52x
Posts: 30053
Joined: Tue Feb 22, 2011 3:47 pm

Re: 09/05/2015 Weekend Update

Post by BullBear52x »

The $xxHL also show a weakness in all markets.
Attachments
1.PNG
My comments are for entertainment/educational purpose only. NOT a trade advice.
User avatar
BullBear52x
Posts: 30053
Joined: Tue Feb 22, 2011 3:47 pm

Re: 09/05/2015 Weekend Update

Post by BullBear52x »

$NYAD signals end of bull run for now. sideways is never easy to trade but I think this is something worth mentioned. Peace!
Attachments
2.PNG
My comments are for entertainment/educational purpose only. NOT a trade advice.
User avatar
MrMiyagi
Posts: 10336
Joined: Sun Oct 16, 2011 12:48 pm

Post by MrMiyagi »

nymo
nymo
User avatar
DellGriffith
Posts: 1803
Joined: Sun Aug 25, 2013 5:24 pm

Re: 09/05/2015 Weekend Update

Post by DellGriffith »

I don't have an immediately play at the moment. I scalped that bounce for a pretty large gain several days ago but sit in cash for now. Just letting the market tell me what to do for now.
bearish as of SPY 406 on 2/17/23
currently: end bearish as of SPY 406 on 3/6/23
tsf
Posts: 554
Joined: Tue Feb 15, 2011 7:49 am

Chinese markets re-open next week

Post by tsf »

http://www.bloomberg.com/news/articles/ ... 20-meeting

China’s Zhou Kept Saying the Bubble ‘Burst’ at G-20 Meeting

September 4, 2015 — 2:50 PM PDT
Updated on September 5, 2015 — 11:32 AM PDT

Zhou Xiaochuan, governor of China’s central bank, said three times to a G-20 gathering that a bubble in his country had “burst,” Japanese Finance Minister Taro Aso said.
It came up in his explanation Friday of what is going on with China’s stock market, according to a Japanese finance ministry official.

It was China, rather than the timing of an interest-rate increase by the Federal Reserve, that dominated the discussion, according to the Japanese official,
with many people commenting that China’s sluggish economic performance is a risk to the global economy and especially to emerging-market nations.


http://www.bloomberg.com/news/articles/ ... cmpid=yhoo

China Market Volatility Nearing End, Says Central Bank Official
September 5, 2015 — 11:25 AM PDT

Volatility in China’s stock markets is nearing its end, a central bank official said, after Group of 20 finance chiefs flagged concerns about potential global spillovers.

The Chinese government has intervened to prevent the “free fall” of the stock market even as it feels an adjustment is “normal,” Zhu Jun,
Director-General in the People’s Bank of China’s international department said in an interview on Saturday in Ankara.

“We think it’s pretty close to the end,” Zhu said, referring to the stock-market volatility.
“To some extent the leverage in the market has been decreased substantially and we think there would be no systemic risk.”

“We think it is quite close to the equilibrium level and we think with time the pressure will be alleviated and the market sentiment will be improved,” said Zhu, referring to the yuan.


https://finance.yahoo.com/news/imfs-lag ... 19327.html

IMF's Lagarde says Fed should not rush its rate rise decision
User avatar
silicon_beaver
Posts: 524
Joined: Wed Feb 23, 2011 4:09 pm
Location: Beaverton OR

Re: 09/05/2015 Weekend Update

Post by silicon_beaver »

Weekly Chart
white red mix pattern,

presently
SPX N=9 (i.e. R-R-R-R-R-R-R-R-R)
index.png
index.png (6.04 KiB) Viewed 4722 times
SPY N=8 (i.e. R-R-R-R-R-R-R-R).
index.png1.png
index.png1.png (5.92 KiB) Viewed 4722 times
what happened in history?
SPX
7/31/2006-9/25/2006, next week up.
3/16/1998-5/11/1998, next week up.
SPY
4/30/2007-6/18/2007, next week down.
3/16/1998-5/4/1998, next week down. Also see above SPX 3/16/1998-5/11/1998.
8/11/1997-9/29/1997, next week up.

Interesting, 3 out of above 4 breaking down lower BB later. While presently pattern, it did break down lower BB first (please read the attached charts).
uempel
Posts: 8685
Joined: Tue Feb 15, 2011 6:38 am

Re:

Post by uempel »

MrMiyagi wrote:
The attachment 1618.png is no longer available
Miyagi, if SPX breaks the recent 1867 low and stays below: the blue channel is broken - unless the move is only a trap. And if the blue channel is broken the market is heading downwards. Well, that's what this long term chart suggests :geek:

377.png
uempel
Posts: 8685
Joined: Tue Feb 15, 2011 6:38 am

Re: 09/05/2015 Weekend Update

Post by uempel »

Here the numeric long term chart:
MA75.png
marcueus
Posts: 129
Joined: Sat Nov 29, 2014 5:27 pm

Re: 09/05/2015 Weekend Update

Post by marcueus »

Uempel - how you make this channel ? I am curious becouse my calculations shows that we are going to arround 1715 before strong move up - next wave up :oops:
tsf
Posts: 554
Joined: Tue Feb 15, 2011 7:49 am

Re: 09/05/2015 Weekend Update

Post by tsf »

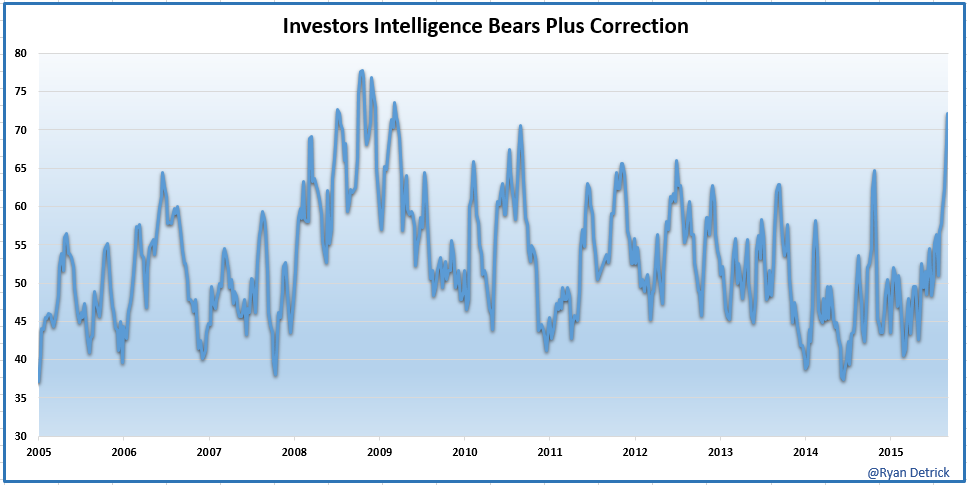
Image


Source:
Ryan Detrick, CMT ‏@RyanDetrick Sep 3
Investors Intelligence bears plus correction up to 72.2%. Most since week of March '09 lows. $SPY
daytradingES
Posts: 2245
Joined: Thu Sep 13, 2012 10:46 am

Re: 09/05/2015 Weekend Update

Post by daytradingES »

Gold closing below 1070 would give 1020 which being less than 1034 could pave the way for $1000 to be tested.
Attachments
temp2.png
Educational only and not trading advice (EO&NTA) :)
Good trading to all
uempel
Posts: 8685
Joined: Tue Feb 15, 2011 6:38 am

Re: 09/05/2015 Weekend Update

Post by uempel »

marcueus wrote:Uempel - how you make this channel ? I am curious becouse my calculations shows that we are going to arround 1715 before strong move up - next wave up :oops:
I didn''t make the channel - the market makes the channel. The market? - or the traders of huge hedge funds who control the moves (up to a certain extent).

That's why TA works most of the time. The traders work with algos which aim at support/resistance levels. And where do they find these support/resistance levels? They apply technical analysis ;)

Have a look at this long term numeric chart. It's kind of obvious that a break of the recent low at SPX 1867 will bring the market down to Fib 38.2% resp to the red Andrews Fork.

Short term: I see a rebound back up to SPX 1980/2010 resistance before the market makes new lows below 1867. But that's my gut feeling and my gut feeling ain't worth 10 cents. I'm just going to wait and see.
BBB.png
Post Reply