Page 1 of 6
10/09/2015 Live Update
Posted: Fri Oct 09, 2015 9:06 am
by Cobra
If you're StockCharts member, please do me a little favor by "vote" and the most importantly "follow" my public chart list HERE. You need "follow" only once but vote can be done everyday, so whenever you have time, please vote for me, thanks! If you're not StockCharts member, you can also help boosting my rank by clicking the link once everyday.
- Please, again, all my calls in the daily live update is for intra-day only, they're absolutely invalid when the closing bell rings. If you're interested in the forecast for days and weeks, Please subscribe my Daily Market Report.
- Personal attack on any board members won't be tolerated. Please limit your topic to trade related only.
- Please no direct link to your personal web site or blog. You must post rich contents here. You can, however, put link to your personal web site or blog as your signature.
- I'm very busy during the trading hour, so your question posted on board might not be answered. For a guaranteed answer to your question please send email to [email protected].
========================================================================================================================================================================
Testing 09/17 high, key time.
Re: 10/09/2015 Live Update
Posted: Fri Oct 09, 2015 9:11 am
by Cobra
Re: 10/09/2015 Live Update
Posted: Fri Oct 09, 2015 9:18 am
by uempel
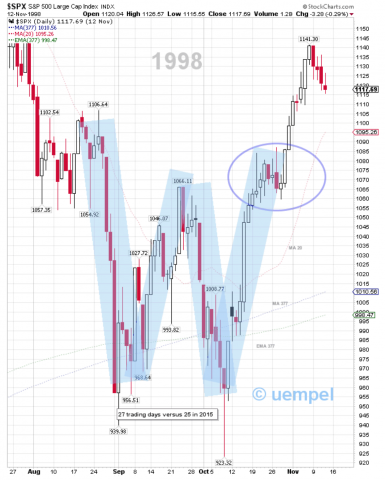
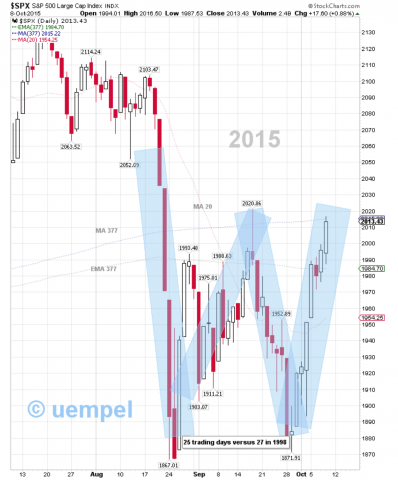
The W pattern in 1998 and 2015 is similar. But there are differences: correction in 1998 was down 22.4% whereas in August/September 2015 the low was at -12.4%. Important moving averages were support in 1998 wheras in 2015 they are now resistance (WMA 75 at SPX 2023 and DMA 377 at 2014).

- 1998 - the crucial moving averages/support are near the bottom of the W

- 2015 - moving averages/resistance at SPX 2014 and SPX 2023
Re: 10/09/2015 Live Update
Posted: Fri Oct 09, 2015 9:21 am
by Unique
ES: 2011.75 100% fib retracement immediate target fulfilled. Next is 2018, 2034 from nightly KISS update.
CL oil: 51 daily 200SMA immediate target fulfilled. Need to see how today closes as the measure move next target is 55 unconfirmed.
Re: 10/09/2015 Live Update
Posted: Fri Oct 09, 2015 9:26 am
by fehro
SPX weekly candle looking bullish, bulls want to keep it above the 50d for a close 1994. Possible resistance in this zone, mind the open gaps above and just below. 20w 2041.73 on the upside. VIX still wedging in a "possible" bullish falling wedge, as we head into OEW next week, bond market closed on Monday.. for Columbus Day.. I believe fwiw.
Re: 10/09/2015 Live Update
Posted: Fri Oct 09, 2015 9:28 am
by fehro
SPX
Re: 10/09/2015 Live Update
Posted: Fri Oct 09, 2015 9:29 am
by fehro
/CL 0.02 short of a 200d tag.. weekly looks bullish, trying to hold 20w sma 50.00
Re: 10/09/2015 Live Update
Posted: Fri Oct 09, 2015 9:35 am
by fehro
Weekly candles look bullish.. a full day to go..tho.
Re: 10/09/2015 Live Update
Posted: Fri Oct 09, 2015 9:36 am
by fehro
SPX dabble small short here 2014
Re: 10/09/2015 Live Update
Posted: Fri Oct 09, 2015 9:38 am
by uempel
Re: 10/09/2015 Live Update
Posted: Fri Oct 09, 2015 9:48 am
by Junior Buffett
uempel wrote:Update:
hg.png
Dont you think 377 been taken already?
Re: 10/09/2015 Live Update
Posted: Fri Oct 09, 2015 9:51 am
by fehro
SPX FOMC mid Sept spike high 2020.86… pennies short from HOD, VIX hold - ish.. no new lows
Re: 10/09/2015 Live Update
Posted: Fri Oct 09, 2015 9:52 am
by Al_Dente
Short-term data for the bears:
The Dow up four days, odds are a red day follows
Yesterday, day five, we defied the odds with FOMC and a green day
Today is day six:
http://www.schaeffersresearch.com/conte ... aign=Recap
And for the longer-term bulls:
“ZWEIG BREADTH THRUST”
When the Zweig indicator (top panel) moves from nadir to zenith (specifically from “0.40 to 0.615”) within TEN DAYS, the bulls are off to the races.
Tom McClellan and Art Hill and Worden use 10 EMA (pink) in their calculation.
Some others use 10 SMA (black).
It looks like we have a major long signal, last seen October 2014 (green vertical lines)
Re: 10/09/2015 Live Update
Posted: Fri Oct 09, 2015 10:04 am
by Cobra
Re: 10/09/2015 Live Update
Posted: Fri Oct 09, 2015 10:10 am
by Tutti
Al_Dente wrote:Short-term data for the bears:
The Dow up four days, odds are a red day follows
Yesterday, day five, we defied the odds with FOMC and a green day
Today is day six:
http://www.schaeffersresearch.com/conte ... aign=Recap
And for the longer-term bulls:
“ZWEIG BREADTH THRUST”
When the Zweig indicator (top panel) moves from nadir to zenith (specifically from “0.40 to 0.615”) within TEN DAYS, the bulls are off to the races.
Tom McClellan and Art Hill and Worden use 10 EMA (pink) in their calculation.
Some others use 10 SMA (black).
It looks like we have a major long signal, last seen October 2014 (green vertical lines)
109zweig.png.png
Thanks AD - Erin @ stock charts has an interesting take on the overbought readings in her morning blog and the similarity with last October. I happen to agree with her general rule that the larger signals dominate the smaller one and all signals should be taken within the context of the broader trend.
Here is her article:
http://stockcharts.com/articles/decisio ... tober.html
Re: 10/09/2015 Live Update
Posted: Fri Oct 09, 2015 10:16 am
by Unique
ES: Currently at 1HR 20EMA bull train support, let's see if bulls continue the trend of sticksaving at moving averages the entire week...very impressive bull train so far
Next support 1HR 50SMA = 1991 currently
Re: 10/09/2015 Live Update
Posted: Fri Oct 09, 2015 10:18 am
by uempel
Junior Buffett wrote:uempel wrote:Update:
hg.png
Dont you think 377 been taken already?
Warren, intraday never counts.
Re: 10/09/2015 Live Update
Posted: Fri Oct 09, 2015 10:18 am
by Heck
ISE Index/ETF calls over five times puts reminiscent of March 2009 market bottom
https://www.ise.com/market-data/isee-index/
Zweig Indicator = >+8% <20 days
http://www.businessinsider.com/zweig-br ... -8-2015-10
Re: 10/09/2015 Live Update
Posted: Fri Oct 09, 2015 10:20 am
by Junior Buffett
uempel wrote:Junior Buffett wrote:uempel wrote:Update:
hg.png
Dont you think 377 been taken already?
Warren, intraday never counts.
Got it! Thax
Re: 10/09/2015 Live Update
Posted: Fri Oct 09, 2015 10:22 am
by Al_Dente
Tutti wrote: Thanks AD - Erin @ stock charts has an interesting take on the overbought readings in her morning blog and the similarity with last October. I happen to agree with her general rule that the larger signals dominate the smaller one and all signals should be taken within the context of the broader trend.
Here is her article:
http://stockcharts.com/articles/decisio ... tober.html
Thanks Toot
