Page 1 of 9
01/13/2016 Live Update
Posted: Wed Jan 13, 2016 10:15 am
by Cobra
If you're StockCharts member, please do me a little favor by "vote" and the most importantly "follow" my public chart list HERE. You need "follow" only once but vote can be done everyday, so whenever you have time, please vote for me, thanks! If you're not StockCharts member, you can also help boosting my rank by clicking the link once everyday.
- Please, again, all my calls in the daily live update is for intra-day only, they're absolutely invalid when the closing bell rings. If you're interested in the forecast for days and weeks, Please subscribe my Daily Market Report.
- Personal attack on any board members won't be tolerated. Please limit your topic to trade related only.
- Please no direct link to your personal web site or blog. You must post rich contents here. You can, however, put link to your personal web site or blog as your signature.
- I'm very busy during the trading hour, so your question posted on board might not be answered. For a guaranteed answer to your question please send email to [email protected].
========================================================================================================================================================================
Possible 3 push up, it'd be confirmed if pullback further upon open.
Re: 01/13/2016 Live Update
Posted: Wed Jan 13, 2016 10:18 am
by Cobra
Re: 01/13/2016 Live Update
Posted: Wed Jan 13, 2016 10:24 am
by fehro
SPX possible bear flag, bearish rising wedge forming on the 5m .. not on this chart.. in between trends here.
Re: 01/13/2016 Live Update
Posted: Wed Jan 13, 2016 10:26 am
by Unique
ES: Consolidation above 1HR 20EMA favours bulls. Still looking for 1950-1955 to be hit which coincides with major resistance of daily 8EMA for the swing short reload.
Re: 01/13/2016 Live Update
Posted: Wed Jan 13, 2016 10:26 am
by uempel
Re: 01/13/2016 Live Update
Posted: Wed Jan 13, 2016 10:27 am
by gappy
Bottom diamond it was, but it took two big ponzi pumps to resolve it. Hourly.
Capture.PNG
because...
aa.PNG

Vote Cobra. glta
Re: 01/13/2016 Live Update
Posted: Wed Jan 13, 2016 10:35 am
by Unique
ES: All my signals indicate "should" blast up here at any moment
Re: 01/13/2016 Live Update
Posted: Wed Jan 13, 2016 10:36 am
by Unique
uempel wrote:Two interesting charts. Both suggest that the stockmarket and oil too have technical support at the recent lows

d.png
WTICOil.png
Great charts
Re: 01/13/2016 Live Update
Posted: Wed Jan 13, 2016 10:41 am
by fehro
SPX .. as per usual.. mind the morning gap ..resistance a tad higher..
Re: 01/13/2016 Live Update
Posted: Wed Jan 13, 2016 10:42 am
by Unique
CL Crude Oil: First time above 1HR 50SMA since Jan 5, this current deadcat bounce looking for 32.00 and 32.50 immediate targets
Re: 01/13/2016 Live Update
Posted: Wed Jan 13, 2016 10:45 am
by thelefteyeguy
uempel wrote:Two interesting charts. Both suggest that the stockmarket and oil too have technical support at the recent lows

d.png
WTICOil.png
just logging in to say thanks for all the great charts the last few days ...esp the Coppock.
I am a long term investor, dont trade much on a daily basis...the indicators help alot.
Thanks
Re: 01/13/2016 Live Update
Posted: Wed Jan 13, 2016 10:48 am
by fehro
/GC .. worth watching gold now.. near key support.. /GC on 50d/20d support 1078.40/1076.70... just below LOD, stopped last week at 20w SMA at HOW. DXY showing weakness, this am.
Re: 01/13/2016 Live Update
Posted: Wed Jan 13, 2016 10:57 am
by Unique
ES: Long 1933, my avg buy is 1937~. Looking for 1950-1955. Stop 1931~
Re: 01/13/2016 Live Update
Posted: Wed Jan 13, 2016 11:00 am
by Cobra
morning hourly black bar.
Re: 01/13/2016 Live Update
Posted: Wed Jan 13, 2016 11:01 am
by uempel
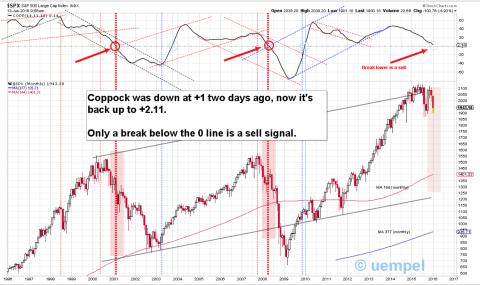
Thanks lefteyeguy, here the monthly Coppock chart. Note that the indicator has not yet crossed the 0 line.
For anybody who wants to know more about this long term indicator - which has a great track record - go to stockcharts.com/chartschool (you don't have to be a subscriber)

- Coppock
thelefteyeguy wrote:uempel wrote:Two interesting charts. Both suggest that the stockmarket and oil too have technical support at the recent lows

The attachment d.png is no longer available
The attachment WTICOil.png is no longer available
just logging in to say thanks for all the great charts the last few days ...esp the Coppock.
I am a long term investor, dont trade much on a daily basis...the indicators help alot.
Thanks
Re: 01/13/2016 Live Update
Posted: Wed Jan 13, 2016 11:04 am
by Cobra
Re: 01/13/2016 Live Update
Posted: Wed Jan 13, 2016 11:12 am
by Unique
Re: 01/13/2016 Live Update
Posted: Wed Jan 13, 2016 11:13 am
by fehro
SPX going for the gap fill.
Re: 01/13/2016 Live Update
Posted: Wed Jan 13, 2016 11:16 am
by Unique
ES: If breaks 1930 here no support until 1922-1924
Re: 01/13/2016 Live Update
Posted: Wed Jan 13, 2016 11:17 am
by Tutti
uempel wrote:Thanks lefteyeguy, here the monthly Coppock chart. Note that the indicator has not yet crossed the 0 line.
For anybody who wants to know more about this long term indicator - which has a great track record - go to stockcharts.com/chartschool (you don't have to be a subscriber)
The attachment juz.png is no longer available
thelefteyeguy wrote:uempel wrote:Two interesting charts. Both suggest that the stockmarket and oil too have technical support at the recent lows

The attachment d.png is no longer available
The attachment WTICOil.png is no longer available
just logging in to say thanks for all the great charts the last few days ...esp the Coppock.
I am a long term investor, dont trade much on a daily basis...the indicators help alot.
Thanks
So here is my yearly CC chart. I use the spread of the 10 and 40 week SMA as confirmation.As of this week, no sell signal and we just had the first false signal since late 1988