Page 1 of 2
08/13/2016 Weekend Update
Posted: Fri Aug 12, 2016 4:23 pm
by Cobra
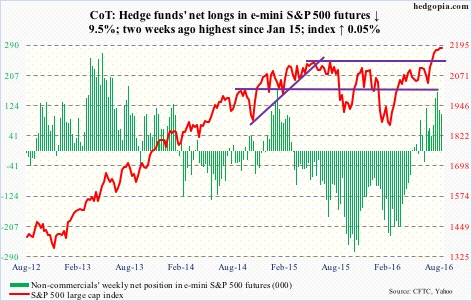
Smart money record short and keep adding short this week despite the market climbing up, so it's case 1.) the top might be in or near!
How I use the chart:
I don't care what's the logic behind the chart. I found it works in the following two cases:
1.) When market up huge, if I see smart money huge short, best if new record short, then I know a short-term pullback is due soon.
2.) When market down, if I see smart money suddenly rises sharply from very negative value, then I know the pullback was over.
So I only use this chart for the above 2 cases. Besides those 2 cases, it means nothing to me. i.e. the absolute value of this chart means nothing to me, I only care if it rises sharply or drops sharply.
Re: 08/13/2016 Weekend Update
Posted: Fri Aug 12, 2016 4:28 pm
by Cobra
Summary of the week's stock picks:
viewtopic.php?f=10&t=2134&p=228450#p228450
Not a bad week.
Re: 08/13/2016 Weekend Update
Posted: Fri Aug 12, 2016 4:44 pm
by nikman
Wow! It would be nice to compare this to 2006-2009 timeframe to see how early does the smart money become this heavily short before the downturn occurs.
Cobra wrote:Smart money record short and keep adding short this week despite the market climbing up, so it's case 1.) the top might be in or near!
How I use the chart:
I don't care what's the logic behind the chart. I found it works in the following two cases:
1.) When market up huge, if I see smart money huge short, best if new record short, then I know a short-term pullback is due soon.
2.) When market down, if I see smart money suddenly rises sharply from very negative value, then I know the pullback was over.
So I only use this chart for the above 2 cases. Besides those 2 cases, it means nothing to me. i.e. the absolute value of this chart means nothing to me, I only care if it rises sharply or drops sharply.
Re: 08/13/2016 Weekend Update
Posted: Fri Aug 12, 2016 5:04 pm
by Cobra
our weekly sentiment poll is here:
viewtopic.php?f=9&t=2140
Re: 08/13/2016 Weekend Update
Posted: Fri Aug 12, 2016 6:05 pm
by Al_Dente
Oy:
Wall Street. banks [GS, JPM, MS, et. al.] asked the Fed for
five more years to comply with the Volcker rule.
“The Fed has already granted three one-year extensions."
“The added grace period would start next year and run through
2022.”
"It's laughable that the biggest, most sophisticated financial firms in the world claim they can't sell the stakes year after year …. Everyone else in America has to comply with the law and Wall Street should also."
“The Fed risks criticism…“
 http://www.reuters.com/article/us-usa-f ... ium=Social
Re: 08/13/2016 Weekend Update
Posted: Fri Aug 12, 2016 6:10 pm
by Al_Dente
Nice new highs on SPX this week
while NYMO and the Summation Index were red.
That is some bullshit right there
Re: 08/13/2016 Weekend Update
Posted: Fri Aug 12, 2016 6:23 pm
by Cobra
the next week's stock picks are here:
viewtopic.php?f=10&t=2142
Re: 08/13/2016 Weekend Update
Posted: Fri Aug 12, 2016 6:26 pm
by Cobra
nikman wrote:Wow! It would be nice to compare this to 2006-2009 timeframe to see how early does the smart money become this heavily short before the downturn occurs.
Cobra wrote:Smart money record short and keep adding short this week despite the market climbing up, so it's case 1.) the top might be in or near!
How I use the chart:
I don't care what's the logic behind the chart. I found it works in the following two cases:
1.) When market up huge, if I see smart money huge short, best if new record short, then I know a short-term pullback is due soon.
2.) When market down, if I see smart money suddenly rises sharply from very negative value, then I know the pullback was over.
So I only use this chart for the above 2 cases. Besides those 2 cases, it means nothing to me. i.e. the absolute value of this chart means nothing to me, I only care if it rises sharply or drops sharply.
you want the whole history, here it is.
Re: 08/13/2016 Weekend Update
Posted: Fri Aug 12, 2016 6:26 pm
by Al_Dente
Appaloosa's David Tepper joined his billionaire-bear peers: Soros, Gundlach, Druckenmiller, Icahn, et. al., and eliminated his SPY and QQQ calls (which together amounted to $664 million), and he reduced other holdings…
He’s now
“only” $3.8 billion in long US equity exposure, down from
$5.7 billion last quarter.
[per his 13-F filing]
“Institutional investors are really just dealing with a couple more zeros than the rest of us.”
[Ben Carson]
Re: 08/13/2016 Weekend Update
Posted: Sat Aug 13, 2016 4:11 am
by superxy
Cobra wrote:nikman wrote:Wow! It would be nice to compare this to 2006-2009 timeframe to see how early does the smart money become this heavily short before the downturn occurs.
Cobra wrote:Smart money record short and keep adding short this week despite the market climbing up, so it's case 1.) the top might be in or near!
How I use the chart:
I don't care what's the logic behind the chart. I found it works in the following two cases:
1.) When market up huge, if I see smart money huge short, best if new record short, then I know a short-term pullback is due soon.
2.) When market down, if I see smart money suddenly rises sharply from very negative value, then I know the pullback was over.
So I only use this chart for the above 2 cases. Besides those 2 cases, it means nothing to me. i.e. the absolute value of this chart means nothing to me, I only care if it rises sharply or drops sharply.
you want the whole history, here it is.
Why is getting more volatile?
Re: 08/13/2016 Weekend Update
Posted: Sat Aug 13, 2016 11:32 am
by Cobra
superxy wrote:Cobra wrote:nikman wrote:Wow! It would be nice to compare this to 2006-2009 timeframe to see how early does the smart money become this heavily short before the downturn occurs.
Cobra wrote:Smart money record short and keep adding short this week despite the market climbing up, so it's case 1.) the top might be in or near!
How I use the chart:
I don't care what's the logic behind the chart. I found it works in the following two cases:
1.) When market up huge, if I see smart money huge short, best if new record short, then I know a short-term pullback is due soon.
2.) When market down, if I see smart money suddenly rises sharply from very negative value, then I know the pullback was over.
So I only use this chart for the above 2 cases. Besides those 2 cases, it means nothing to me. i.e. the absolute value of this chart means nothing to me, I only care if it rises sharply or drops sharply.
you want the whole history, here it is.
Why is getting more volatile?
It's not volatile, it's volume, more and more people start using futures as hedge.
Re: 08/13/2016 Weekend Update
Posted: Sat Aug 13, 2016 12:13 pm
by fehro
COT - Net commitments of Futures Traders. Fwiw to look at long term similar to Cobra's chart?? not sure .. net position of commercial hedgers? or all hedgers?
*NOT sure when these charts get updated.. usually on the week.. but could be a week late.. as they are free and not subscription base.. so keep that in mind.
The Commitments of Traders Report is split into three groups:
Commercials, consisting of Producer/Merchant/Processor/User and Swap Dealers
Non-Commercials or Large Speculators, consisting of Managed Money and Other Reportables
Small Speculators
The theory is "usually" the "overall" commercial hedgers are "right" - remember it is
"net positions" = (Longs - shorts)
Also extreme levels are turning points.
Anyhow way too much info it you want to check it out..
1st set of charts
http://www.barchart.com/futures/cot.php
and
http://www.barchart.com/chart.php?sym=N ... Date=#jump
2nd charts
http://www.nowandfutures.com/cot.html
3rd charts
http://www.timingcharts.com/
Last charts
http://cotbase.com/
*Note fwiw.. Open Interest / vol is dropping off over the last few months.. on some = more volatility??
Re: 08/13/2016 Weekend Update
Posted: Sat Aug 13, 2016 12:56 pm
by fehro
http://www.timingcharts.com Totally customizable.. way way way too much info… Below 20yr e-Mini Nasdaq 100 overall (commercial Longs - commercial Shorts) & ( Com Long - Com Short / Open interest )
Re: 08/13/2016 Weekend Update
Posted: Sat Aug 13, 2016 2:17 pm
by superxy
fehro wrote:http://www.timingcharts.com Totally customizable.. way way way too much info… Below 20yr e-Mini Nasdaq 100 overall (commercial Longs - commercial Shorts) & ( Com Long - Com Short / Open interest )
So much info...thanks, but what is takeaway?
Re: 08/13/2016 Weekend Update
Posted: Sat Aug 13, 2016 2:23 pm
by fehro
superxy wrote:fehro wrote:http://www.timingcharts.com Totally customizable.. way way way too much info… Below 20yr e-Mini Nasdaq 100 overall (commercial Longs - commercial Shorts) & ( Com Long - Com Short / Open interest )
So much info...thanks, but what is takeaway?
It's only one piece of the puzzle, as people are adding protection/hedges to their long positions as we make new highs.. is there more room to move? .. sure.. both on the hedge side and long side.
Re: 08/13/2016 Weekend Update
Posted: Sat Aug 13, 2016 2:59 pm
by Trades with cats
Couple of years ago I searched the internet to see if anyone had a way to trade the COT report. Never found anything that had a superior record. Problem with the COT is it is only required to report US trades. So last time oil went up to 140 goldman was telling the public to buy while it's Swiss based agents were dumping like crazy. The selling wasn't shown in the COT. I like to think of it like finding a scrap of torn paper. You have a lot of information but it isn't complete.
Here is how they look at it at hedgopia.
Re: 08/13/2016 Weekend Update
Posted: Sat Aug 13, 2016 3:29 pm
by Al_Dente
Short term:
Participation hasn’t recovered yet.
In the July push to new highs, the percent of SPX stocks participating (above their 20ma) was 94.2%.
Friday it was 64.4%.
This is a team sport. Look at it this way: last month 474 of the roughly 503 SPX stocks won the gold (503 x 94.2%).
Friday it was silver: 324 of the SPX stocks were above their 20ma (503 x 64.4%).
Let’s go team, let’s go
Re: 08/13/2016 Weekend Update
Posted: Sat Aug 13, 2016 3:35 pm
by Al_Dente
...............
Re: 08/13/2016 Weekend Update
Posted: Sat Aug 13, 2016 4:05 pm
by Al_Dente
Here’s another measure of Participation, Breadth:
As the indices make new highs, many individual components of the indices should also make new highs.
You can see this currently isn’t the case…. yet…
One example: in July about 92 of the SPX stocks made new 52-week highs. Friday it was 26.
This divergence has been going on for one+ month, so it’s not the timely indicator we wish for.
Mid-term Breadth. Same thing, different view:
Since Feb 12, the day after the Feb 11 low, the HIGH LOW PERCENT (percentage of net new 52-week highs) on the SPX has been green.
You can see it declining but it is still in the green since Feb 12
Re: 08/13/2016 Weekend Update
Posted: Sun Aug 14, 2016 12:19 pm
by nikman
Cobra wrote:superxy wrote:Cobra wrote:nikman wrote:Wow! It would be nice to compare this to 2006-2009 timeframe to see how early does the smart money become this heavily short before the downturn occurs.
Cobra wrote:Smart money record short and keep adding short this week despite the market climbing up, so it's case 1.) the top might be in or near!
...
you want the whole history, here it is.
Why is getting more volatile?
It's not volatile, it's volume, more and more people start using futures as hedge.
Thanks Cobra for clarifying this part (regarding the volume).