Page 1 of 1
05/02/2026 Weekend Update
Posted: Fri May 01, 2026 4:36 pm
by Cobra
Up 5 weeks in a row, the next week has 43% chances to close up, 70% to make a higher high.
So more up.
Re: 05/02/2026 Weekend Update
Posted: Fri May 01, 2026 7:55 pm
by te_fern
Over the weekend, please take a little time to vote for Cobra, thanks:
https://stockcharts.com/public/1684859/ ... /533449377
Re: 05/02/2026 Weekend Update
Posted: Sat May 02, 2026 12:28 pm
by Trades w 2 Cats
Daily showing an obvious impulsive five waves up. Open question is the Friday doji. Confident the Hooray its Monday crowd will lift us a bit more.
Re: 05/02/2026 Weekend Update
Posted: Sat May 02, 2026 12:30 pm
by Trades w 2 Cats
I don't like the 60 minute because of all the Globex session bars. But it does give us some hints. Sure looks like we may be book ended with RSI etc.
Re: 05/02/2026 Weekend Update
Posted: Sat May 02, 2026 12:38 pm
by Trades w 2 Cats
I added a composite volume profile to the 30,000 tick chart. I also added my new toy, a Super Trend using a 2 pole 55 bar Butterworth with a half 21nATR offset.Will chop you to bits in a flat market but seems to do well on trend days. My take away on this is the On Balance Volume shows a clear three push up, This matches the talking heads saying the funds were trying to get their holdings back in alignment with the indexes. You see the less careful buying on the last day of the month then the flat line on the first day of the month.
Re: 05/02/2026 Weekend Update
Posted: Sat May 02, 2026 12:51 pm
by Trades w 2 Cats
My actual trading chart the venerable 2000 tick. I have added a second VWAP for the open outcry trading hours. Seems to be helpful. Forced me to cancel the standard deviation bands around VWAP. I did replace the regression line based super trend with the 2 pole Butterworth. The obvious change is the Price Action Swing Delta set for default swing strength of 7. I like drawing the zig zag Gann style. I am using ticks and bars for the labels. Since I keep atr in ticks and space the horizontal lines in ATRs and use an automatic stop loss of 1 ATR it helps me pretend I have a cohesive system. Ha Ha. Chart is pretty full when you have the full day on the screen but not too bad with just an hour. Big take away was the way ATR fell off the chart down to 8 ticks at the close.
Re: 05/02/2026 Weekend Update
Posted: Sat May 02, 2026 1:09 pm
by JFR
SPY daily
Overvalued.
Rising on fumes, imo.
Irrational exuberance. Desperation. Gotta park the money somewhere for the giant funds. Like a ponzi scheme --> the last last ones in get burned.
Nevertheless, a careful playing of the charts is always possible.
Breakout. All indicators signal Buy, except the Bollinger upper band is not being pushed yet. And the volum is low for a breakout.
This chart is uber bullish. Play it with day trades and some short term swing trades. IMO.
As of May 2026, the S&P 500 trailing P/E ratio is approximately 27–31, indicating a high valuation compared to the historical mean of 16–18. The 5-year average P/E is roughly 23, suggesting the market is currently overvalued, driven by high technology sector valuations. Forward 12-month P/E estimates are lower, around 22–23, reflecting projected earnings growth.
Re: 05/02/2026 Weekend Update
Posted: Sat May 02, 2026 2:00 pm
by BullBear52x
"It is what it is department" Too far too fast, the optimism is out of control.

as a short-term traders, we trade what is in front of us. I can't see what coming tomorrow let alone trying to predict what will happen in 3 months, I will leave that to the experts.
On Wednesday, the FOMC, put on the crack, but no follow through on Thursday and now we saw it stalled on Friday, daily shooting star/reverse hammer, bearish candle stick. the range on Friday will determine the direction if top was put in. if so, I want to see a red summation index. From there we can see if there is bearish move follow through. simple stuff, patience and risk management is the key to any time frame of a trade. not Hormuz or Fed, or any other chaos just to justify your personal feeling.

Swing setup: in a buy, make or break we will find out before the market open.
Intraday: we have a negative price action on Friday, a bearish follow through is to be expected, but this time frame can change on a dime. same playbook, different day. trade well. Peace!
Re: 05/02/2026 Weekend Update
Posted: Sun May 03, 2026 4:37 pm
by AAT
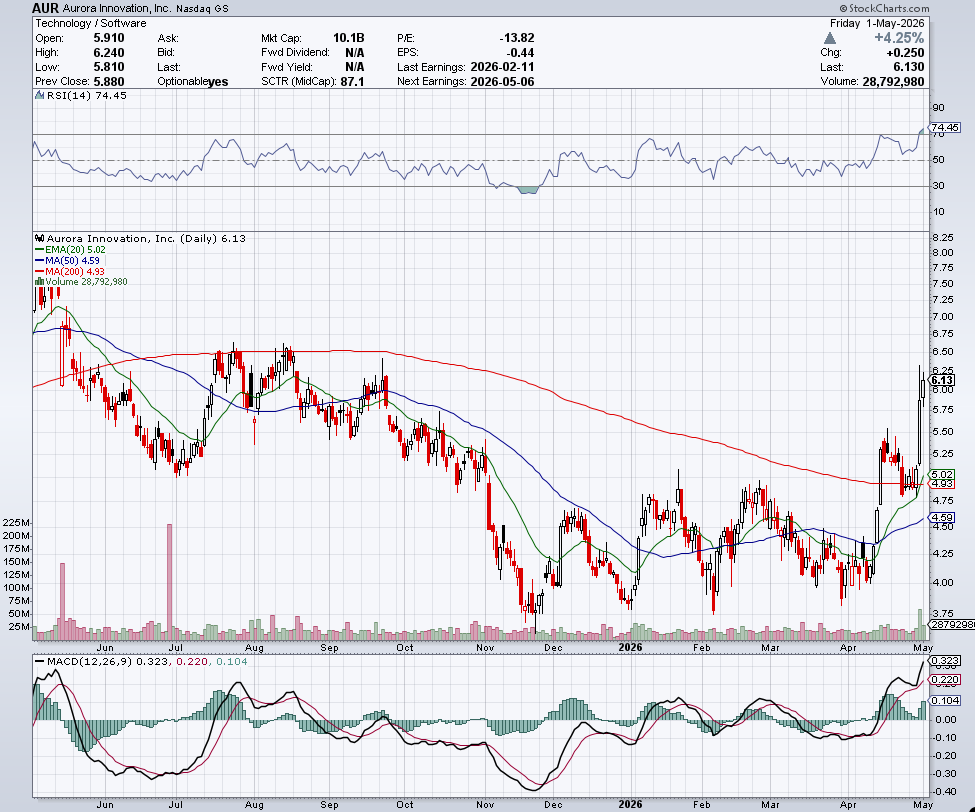
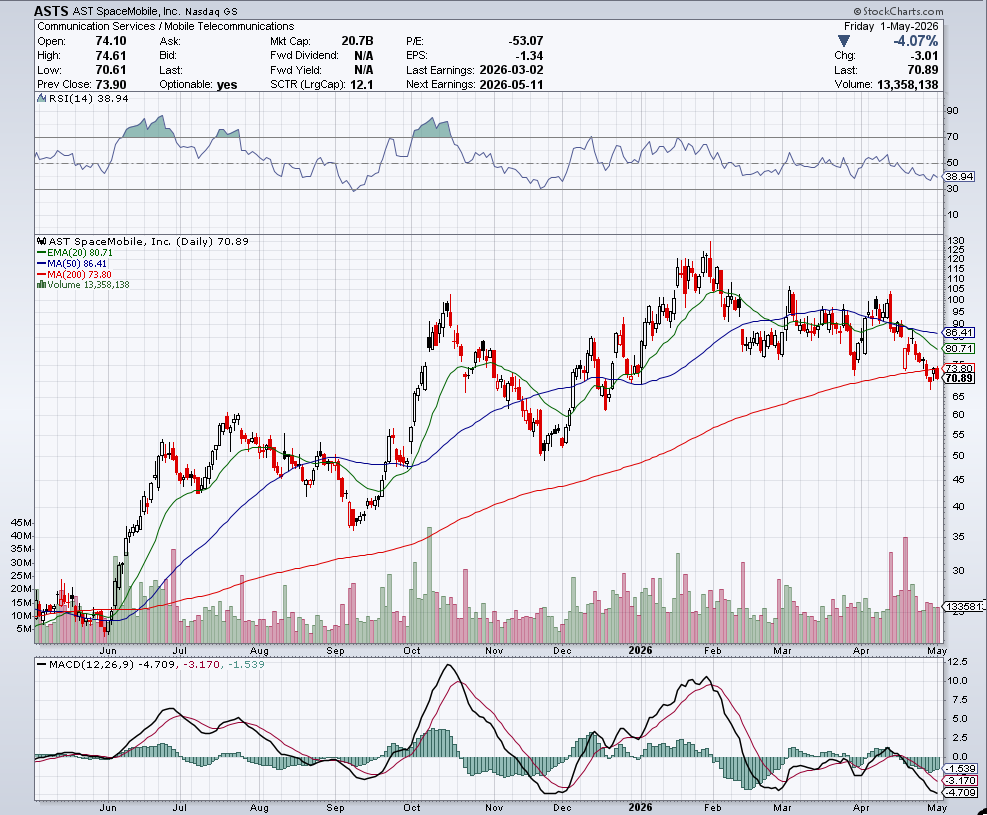
Thursday, a lot of high beta/growth small to mid caps were up, following previous algo-controlled declines. That's especially true of the space sector, which is preparing for the SpaceX IPO, expected to be in June. Whether or not these kinds of stocks can sustain rallies can indicate the overall health of a bull market. Among them, my favorites are ASTS and AUR, and full disclosure, I own both, with a lot of ASTS.
ASTS : AST Spacemobile is building a wholesale satellite broadband cell phone service that works with ordinary, unmodified phones at 5G speeds and integrates directly into phone company networks. It's already partnered with AT&T and Verizon, along with many other major phone companies and the Department of Defense. The last big hurdle is getting satellites built and put in orbit, so the key catalyst everyone's waiting impatiently for is the shipment of batches of completed satellites.
AUR : Aurora Innovation makes autonomous self-driving freight trucks which are now entering deployment, and the technology will be applicable to all kinds of other vehicles in the future. Within the sector, it's a leader on safety and sensors. It was up last week on news of a deal to deliver 500 trucks to a customer.