Back to www.cobrasmarketview.com |
humm!uempel wrote:I've been following this indicator for a few days and so far it looks as though it's a dud... Close-up:


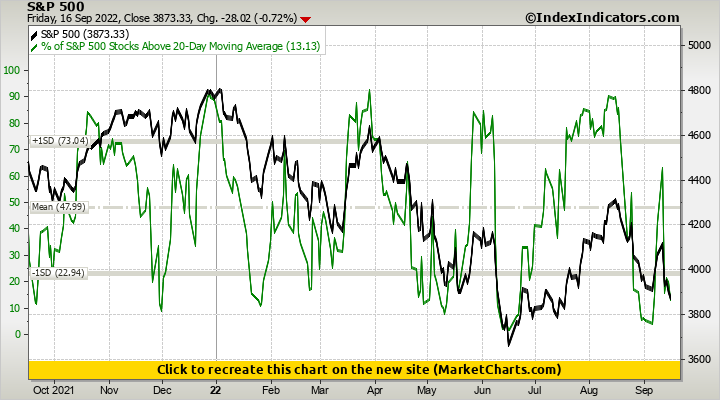
nice finding, here is my internals, from these reading I can not be overly bearish, especially summation index and record high percent index the way they are now. these guys must be weak enough, for now the summation index is below zero but still green, $RHNYA need to be below 50% before bearish trend can sustain, and look at the rest of my chart here, these are end of day data so they may be lagging a bit.Ratbastrd wrote:Would be interested in feedback from the board here. Stumbled across this the other day when looking at internals. I noticed the big divergence between SPX and BPSPX. I have measured this with correlation SPX below the main section of the chart. Current reading is -.11 http://stockcharts.com/h-sc/ui?s=$BPSPX ... =258748664
Here is where this gets interesting, I have looked back 20 years. This condition has only occurred a handful of times in the last 20 years (15+ times or so). The condition doesn't last very long (a few days) and in almost every case was followed by a rapid but short correction 50 points on average, a few times larger. A few times the divergence grew (but that is improbable here I'll explain below)
The occurrences seem to come in swarms, typically as markets are reaching major tops, and there are years between instances.
Here is the cool part, to resolve the correlation issue, either asset managers start buying large quantity of stock across the board to bring the bullish percentages up, or the market sells off to bring the correlation back in order.
Problem is a major rally here is highly improbable given the location of the daily/weekly/monthly Bollinger bands (daily BB top =1692) (weekly bb top= 1715) (monthly top 1718). http://stockcharts.com/h-sc/ui?s=$SPX&p ... 4061871527
Curious if anyone see's an alternative outcome here. This is one of the most obvious tells I have seen in a long time.
oy!knock wrote:Let's see if this plays out.
Ratbastrd wrote:Would be interested in feedback from the board here. Stumbled across this the other day when looking at internals. I noticed the big divergence between SPX and BPSPX. I have measured this with correlation SPX below the main section of the chart. Current reading is -.11 http://stockcharts.com/h-sc/ui?s=$BPSPX ... =258748664
Here is where this gets interesting, I have looked back 20 years. This condition has only occurred a handful of times in the last 20 years (15+ times or so). The condition doesn't last very long (a few days) and in almost every case was followed by a rapid but short correction 50 points on average, a few times larger. A few times the divergence grew (but that is improbable here I'll explain below)
The occurrences seem to come in swarms, typically as markets are reaching major tops, and there are years between instances.
Here is the cool part, to resolve the correlation issue, either asset managers start buying large quantity of stock across the board to bring the bullish percentages up, or the market sells off to bring the correlation back in order.
Problem is a major rally here is highly improbable given the location of the daily/weekly/monthly Bollinger bands (daily BB top =1692) (weekly bb top= 1715) (monthly top 1718). http://stockcharts.com/h-sc/ui?s=$SPX&p ... 4061871527
Curious if anyone see's an alternative outcome here. This is one of the most obvious tells I have seen in a long time.
I got what the rat were saying,uempel wrote:Bullbear 52x, Ratbastrd writes: ...a rapid and short correction....
Might be a intraweek matter.


