H/L est 1968.75 1940.00
Breakdown= 1938.00
----
both 68.75 and breakdown don't co-exist unless there is a larger range than I am expecting
so 65 (just in) may be the HOD and then somewhere around 42 to 40.5 the LOD.
=== low confidence on the estimates today ====
--------------------
On another thought - if raising 0.25 would have been neg for equities and not raising is neg for equities - it seems the markets have said FY to the Fed and MSM lies that the Fed can do anything other than line the pockets of bankers (the fed's owners and controllers) at the expense of the rest of us. So with the fox given charge of the hen-house it seems little wonder the chicks are finally realizing the sky is falling.
The bankers lining their pockets "experiment" with trillions of taxpayer dollars and corporations selling their soul (and the workers jobs) to China is shown for the theft by the 1% that it is.
Commodities are multiyear lows and sinking.
Suddenly Dr Copper has been forgotten has he says, "recession/depression" and the MSM has been told by the US Bureau of Lying Statistics - everyone has jobs and the economy is growing -
"Sure, sure, it tis" - in Irish brogue
Last edited by daytradingES on Fri Sep 18, 2015 11:05 am, edited 1 time in total.
Educational only and not trading advice (EO&NTA) Good trading to all
not clear it's double top or rectangle or ascending triangle, wait.
Attachments
Like to read more of my commentaries? Please subscribe my Daily Market Report. Subscribers can find all the members only posts HERE. StockCharts members, please vote for me HERE, thanks.
well, it's kind of ascending triangle breakout. so the past rule still applies: always assume up.
Attachments
Like to read more of my commentaries? Please subscribe my Daily Market Report. Subscribers can find all the members only posts HERE. StockCharts members, please vote for me HERE, thanks.
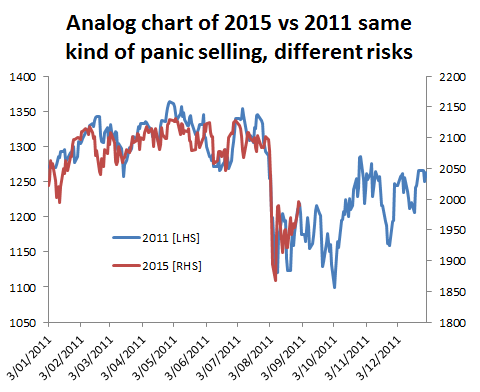
Should SPX follow the 2011 script there will be one more bounce - a fifth bounce - before SPX tanks below the previous low at 1867. Note - this is hypothetical and just an observation. I'm not betting on it as it is very unlikely that SPX copies the last big correction one-to-one
Like to read more of my commentaries? Please subscribe my Daily Market Report. Subscribers can find all the members only posts HERE. StockCharts members, please vote for me HERE, thanks.
uempel wrote:Should SPX follow the 2011 script there will be one more bounce - a fifth bounce - before SPX tanks below the previous low at 1867. Note - this is hypothetical and just an observation. I'm not betting on it as it is very unlikely that SPX copies the last big correction one-to-one
Like to read more of my commentaries? Please subscribe my Daily Market Report. Subscribers can find all the members only posts HERE. StockCharts members, please vote for me HERE, thanks.
unempel
This is the formation that I was trying to describe a few days ago. If you run the blue lines under your large area labelled #1, it connects with the top and bottom right before your area labelled #1. On a 5 hour chart there is a space and that area in a #1 looks like an island.