Back to www.cobrasmarketview.com |
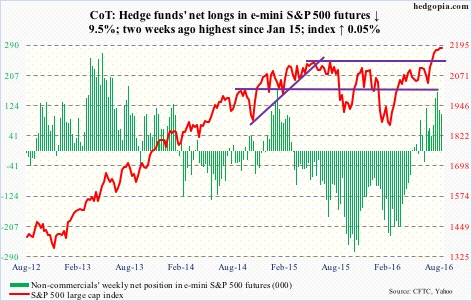
Cobra wrote:Smart money record short and keep adding short this week despite the market climbing up, so it's case 1.) the top might be in or near!
How I use the chart:
I don't care what's the logic behind the chart. I found it works in the following two cases:
1.) When market up huge, if I see smart money huge short, best if new record short, then I know a short-term pullback is due soon.
2.) When market down, if I see smart money suddenly rises sharply from very negative value, then I know the pullback was over.
So I only use this chart for the above 2 cases. Besides those 2 cases, it means nothing to me. i.e. the absolute value of this chart means nothing to me, I only care if it rises sharply or drops sharply.
you want the whole history, here it is.nikman wrote:Wow! It would be nice to compare this to 2006-2009 timeframe to see how early does the smart money become this heavily short before the downturn occurs.
Cobra wrote:Smart money record short and keep adding short this week despite the market climbing up, so it's case 1.) the top might be in or near!
How I use the chart:
I don't care what's the logic behind the chart. I found it works in the following two cases:
1.) When market up huge, if I see smart money huge short, best if new record short, then I know a short-term pullback is due soon.
2.) When market down, if I see smart money suddenly rises sharply from very negative value, then I know the pullback was over.
So I only use this chart for the above 2 cases. Besides those 2 cases, it means nothing to me. i.e. the absolute value of this chart means nothing to me, I only care if it rises sharply or drops sharply.
Why is getting more volatile?Cobra wrote:you want the whole history, here it is.nikman wrote:Wow! It would be nice to compare this to 2006-2009 timeframe to see how early does the smart money become this heavily short before the downturn occurs.
Cobra wrote:Smart money record short and keep adding short this week despite the market climbing up, so it's case 1.) the top might be in or near!
How I use the chart:
I don't care what's the logic behind the chart. I found it works in the following two cases:
1.) When market up huge, if I see smart money huge short, best if new record short, then I know a short-term pullback is due soon.
2.) When market down, if I see smart money suddenly rises sharply from very negative value, then I know the pullback was over.
So I only use this chart for the above 2 cases. Besides those 2 cases, it means nothing to me. i.e. the absolute value of this chart means nothing to me, I only care if it rises sharply or drops sharply.
It's not volatile, it's volume, more and more people start using futures as hedge.superxy wrote:Why is getting more volatile?Cobra wrote:you want the whole history, here it is.nikman wrote:Wow! It would be nice to compare this to 2006-2009 timeframe to see how early does the smart money become this heavily short before the downturn occurs.
Cobra wrote:Smart money record short and keep adding short this week despite the market climbing up, so it's case 1.) the top might be in or near!
How I use the chart:
I don't care what's the logic behind the chart. I found it works in the following two cases:
1.) When market up huge, if I see smart money huge short, best if new record short, then I know a short-term pullback is due soon.
2.) When market down, if I see smart money suddenly rises sharply from very negative value, then I know the pullback was over.
So I only use this chart for the above 2 cases. Besides those 2 cases, it means nothing to me. i.e. the absolute value of this chart means nothing to me, I only care if it rises sharply or drops sharply.
So much info...thanks, but what is takeaway?fehro wrote:http://www.timingcharts.com Totally customizable.. way way way too much info… Below 20yr e-Mini Nasdaq 100 overall (commercial Longs - commercial Shorts) & ( Com Long - Com Short / Open interest )
It's only one piece of the puzzle, as people are adding protection/hedges to their long positions as we make new highs.. is there more room to move? .. sure.. both on the hedge side and long side.superxy wrote:So much info...thanks, but what is takeaway?fehro wrote:http://www.timingcharts.com Totally customizable.. way way way too much info… Below 20yr e-Mini Nasdaq 100 overall (commercial Longs - commercial Shorts) & ( Com Long - Com Short / Open interest )
Thanks Cobra for clarifying this part (regarding the volume).Cobra wrote:It's not volatile, it's volume, more and more people start using futures as hedge.superxy wrote:Why is getting more volatile?Cobra wrote:you want the whole history, here it is.nikman wrote:Wow! It would be nice to compare this to 2006-2009 timeframe to see how early does the smart money become this heavily short before the downturn occurs.
Cobra wrote:Smart money record short and keep adding short this week despite the market climbing up, so it's case 1.) the top might be in or near!
...

