Like to read more of my commentaries? Please subscribe my Daily Market Report. Subscribers can find all the members only posts HERE. StockCharts members, please vote for me HERE, thanks.
triangle? which is continuation in theory but more reversal pattern nowadays
Attachments
Like to read more of my commentaries? Please subscribe my Daily Market Report. Subscribers can find all the members only posts HERE. StockCharts members, please vote for me HERE, thanks.
Hi Al, I was not aware: next to all your TA work you publish a magazine over in Europe? A journal for afficionados? You're a real whizz-kid Don't know who Betty Bossi is, but Gault Millau rings a bell: they guide us to the best pasta in town ...
Al_Dente wrote:
The attachment 329heat.png.png is no longer available
uempel wrote:Hi Al, I was not aware: next to all your TA work you publish a magazine over in Europe? A journal for afficionados? You're a real whizz-kid Don't know who Betty Bossi is, but Gault Millau rings a bell: they guide us to the best pasta in town ...
Disclaimer: I am not an investment advisor. This is just my opinion NOT investment advice.
2360 ES was the minimum high before a sell down from the wave counters a couple of days ago, Looks like consolidation hoping for somebody with unlimited pockets to come in. So here we are couldn;t make it to yesterday's high after the London/Frankfort close and volume continues to decline. It is supposed to be important for the retail funds to show green at the end of the quarter, but ETF's can't play the window dressing game. Nor can they pick and choose on the way up or the way down. Just say'in.
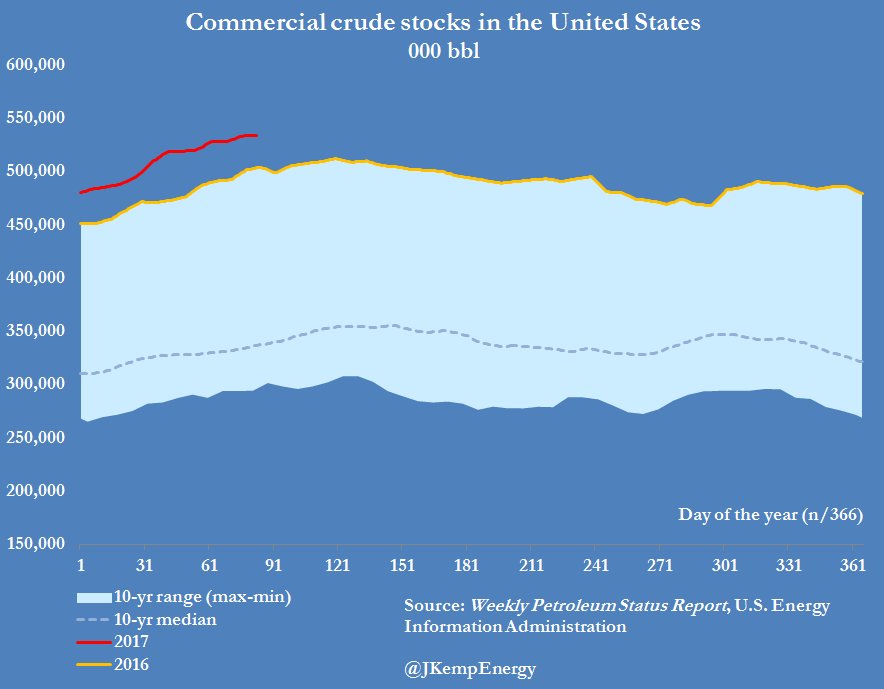
Waiting for something to happen here are two charts from John Kemp today. They say loudly that refineries are about where they were last year but crude inventory isn't. He has more charts (OF COURSE) showing that gasoline and distillate stockpiles are coming down and are below last year. Since Goldman has been emphasizing the significance of our ever expanding exports to Mexico I am guessing that is what is going on because the miles driven reports the last couple of months would show the opposite effect. I would add that it is logical, given several years of record car sales, that average on the road fleet mileage is up so it would follow that only steady increases in miles driven would reduce gasoline inventories.
You can see that if inventory doesn't start drawing within 4 more reports it will be time for the longs to panic,
Like to read more of my commentaries? Please subscribe my Daily Market Report. Subscribers can find all the members only posts HERE. StockCharts members, please vote for me HERE, thanks.
Trades with cats wrote:... given several years of record car sales, that average on the road fleet mileage is up so it would follow that only steady increases in miles driven would reduce gasoline inventories.
...
Is fuel efficiency of the vehicle fleet overall improving as older clunkers are junked and newer vehicles represent greater portions of the overall fleet?
Is that a modestly confounding factor for charting consumption?
Fleet Milage - I have pulled a travel trailer for years and years. The mileage rating on the new trucks and SUV's is amazing given where they were. Trucks and SUV's are selling big. My old v-8 Expedition could get the same milage as the new ones, 16 or so, but only with cruse control doing 55 with a tailwind someplace flat like Ohio. We were lucky to get 11 around town. So back of the cocktail napkin looks like 25 to 35% gain in 10 years or so. http://www.fuelly.com/car/ford/f-150
QED-
Thanks for the link. I think the article has a huge half truth but it is a good read and clearly states the message the street wants retail to get.
The half truth is that they keep referring to classical statistics, which of course are not valid for the stock market, even though we all do it. The two fundamental violations that I am aware of are; first there is no such thing as a Gaussian or normal distribution in the market, only fat tailed distributions, and second the price bars on our chart are not independent of the proceeding bars the way dice rolls or coin flips are.
Trades with cats wrote:QED-
Thanks for the link. I think the article has a huge half truth but it is a good read and clearly states the message the street wants retail to get.
The half truth is that they keep referring to classical statistics, which of course are not valid for the stock market, even though we all do it. The two fundamental violations that I am aware of are; first there is no such thing as a Gaussian or normal distribution in the market, only fat tailed distributions, and second the price bars on our chart are not independent of the proceeding bars the way dice rolls or coin flips are.
Don't know who Betty Bossi is, but Gault Millau rings a bell: they guide us to the best pasta in town ...

 You can see that if inventory doesn't start drawing within 4 more reports it will be time for the longs to panic,

