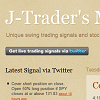
cougar wrote:VIX 130 min: in 4 previous circumstances, VIX under the Acceleration Band resulted in a strong UP move.
An impulsive reentry inside the channel would be for me a first indication of reversal…This should happen within 2 days, in line with Cobra’s suggested timing for a top.
cougar,
As always, interesting charts. What is the yellow band on the VIX chart? BTW, and confirming other posts including Cobra's astute analysis, my "time band" for a short term reversal stands at 10/10 to 10/14. The 10/10 price high exceeded 1 std. dev. above the average for the prior 6 minor up trends. From my experience, this may be interpreted as suggesting that the intermediate trend could be changing from down to up, and that a "higher low" may be expected on the next minor down trend.
Swing to Intermediate SPX Analysis - multiple time frame - Daily & 60 min time and price cycle analysis.
Usually trade SSO / SDS
I'm (obviously) new here but I thought I would add my 2 cents worth. Richard Russell (a bear) feels the market is over sold. Me personally, my broker has been driving me nuts and so I've been attempting to understand ways to attempt to understand the market, in essence become a full time student of the markets.
The P&F chart of TNA shows down. P&F for TZA shows down (confusing) but the TVIX P&F shows up. Now looking at the 1 hr MACD and Elliot waves of both TNA and TZA, it looks like a turn in the market is starting to occur.
Feel free to let me know if I'm on the right track on what I'm looking at. If there are gaping holes in what I'm looking at, as stated above, my desire is to become a full time student of the markets (but to ace nearly all exams... )
Don't analyze into the specific ETFs. My suggestion is to look and T/A the hell out of SPX/RUT. Leave the betting of the ETFs to each individual.
Cheers,
Tdo722
I agree with Tdo722, (I imagine, there must be 722 To Do's )
Juiced ETF's, especially, tend to lose value during even minor trend changes (3 to 10 day). They are meant for day or swing trades only. Placing stops on juiced etf's based on prior minor swing high's or low's can get you stopped out fairly easily, because the etf will reach the stop before the underlying index reaches it's prior high or low.
Swing to Intermediate SPX Analysis - multiple time frame - Daily & 60 min time and price cycle analysis.
Usually trade SSO / SDS
Check what happened after the highlighted area ( a choppy advance then an impulsive down leg ).. so if that pattern will playout, then we will stay in this range until the year end, then down again but harder to 1010 area.. and that is really big IF.
do I trade based on it ? no way ...
KENA wrote:Lot of P bars yesterday..Still to be filled are 117.72 and 115.53..I use TD Ameritrade SPY 5 min.
Sorry this was ans. for..Pablorynx (Thats quite a name)
Thank you, I've been trying to tease out the phantom bar phenomenon. I'm using bloomberg and do not always see the same p-bars as other have. Usually, it's exclusive tho, since when I see a p-bar, most people on the forum can see as well.