not a typical pullback to EMA20, but now I see volume surge, wait for the next few bars.
Attachments
Like to read more of my commentaries? Please subscribe my Daily Market Report. Subscribers can find all the members only posts HERE. StockCharts members, please vote for me HERE, thanks.
Cobra wrote:finally touched ema20, usually H2 is long so wait for h2.
Cobra: I know you dont like me asking this question, but how do you define H2
Go to Getting Started and see there. I haven't seen H2 yet.
Like to read more of my commentaries? Please subscribe my Daily Market Report. Subscribers can find all the members only posts HERE. StockCharts members, please vote for me HERE, thanks.
On any given chart it's the most often one I see which is often changed later to a wave 2 or an X. More often an X wave which means another corrective set of three waves are coming. EW is enigmatic, but now it has plainly been gamed by the PTB. One should not try to learn it without first reading Prechter (who has been wrong for 350+ SPX points with his major time-frame call) who wrote the clearest book on it. I'm not saying it's going to make sense now as much as it used to, but having the theory down and trying to adhere to rules is the best way to prevent bias. I wanted to get long this morning if it held, but blinked and the machines took it away.
H2 long, let's see. I'm not sure, don't follow. I don't do this kind of small setup, I only do one day trade per day, so my way is kind of day swing, not scalp, OK.
Attachments
Like to read more of my commentaries? Please subscribe my Daily Market Report. Subscribers can find all the members only posts HERE. StockCharts members, please vote for me HERE, thanks.
by the way, my today's trade is already done. the target is hit at the day high and I've already half out with the reset sit above a breakeven stop loss. so I'm pretty much done today.
Like to read more of my commentaries? Please subscribe my Daily Market Report. Subscribers can find all the members only posts HERE. StockCharts members, please vote for me HERE, thanks.
Interesting reading from Marcus Rose on Google's earnings tomorrow from an astro point of view... I guess we will see what happens later today. From his point of view, it is not looking good for Google...
GOOGLE REPORTS EARNINGS ON APRIL 12, 2012
Today Google will report Earnings at 4h30 pm EST after the market's close.
Will it disappoint or even exceed expectations ?
This depends on how people will look at it. And the answer to that is written in the stars.
Google was officially filed for incorporation on Friday...September 4, 1998...but incorporation became likely effective on Monday, September 7, 1998.
Google started first trading on Thursday August 19, 2004.
Now the key for a financial astrologer is to find the key factors in the Natal chart(s) and then see whether the Natal chart(s) is better affected by the current stars in the skies on April 12, 2012 (the day before the earnings)...or on April 13, 2012 (the day after the earnings).
For April 12, 2012 and April 13, 2012 my analysis says that the stars are much better on April 12, 2012 for Google as they are on April 13, 2012. This means that today's earnings are likely to disappoint market participants in a major way...and market players are likely to sell Google...so that the stock will gap down on the opening of April 13, 2012.
Please note that the earnings from Google itself, must not be bad at all. What the natal charts are measuring is just how people PERCEIVE the earnings to be. And this does not look very well for April 13, 2012...that means the astrology clearly suggests to us that the stock price is going down...and that Google is going to disappoint, no matter how good or bad its earnings really are.
Cobra wrote:H2 long, let's see. I'm not sure, don't follow. I don't do this kind of small setup, I only do one day trade per day, so my way is kind of day swing, not scalp, OK.
Cobra,
What do you trade? Is it what is listed on your implies system? Do you usually trade like the SPY/markets or do you do individual stocks?
it's a successful H2. if you don't understand the whole process, then forget about it, this kind of scalp requires to follow the rule strictly.
Attachments
Like to read more of my commentaries? Please subscribe my Daily Market Report. Subscribers can find all the members only posts HERE. StockCharts members, please vote for me HERE, thanks.
Cobra wrote:H2 long, let's see. I'm not sure, don't follow. I don't do this kind of small setup, I only do one day trade per day, so my way is kind of day swing, not scalp, OK.
Cobra,
What do you trade? Is it what is listed on your implies system? Do you usually trade like the SPY/markets or do you do individual stocks?
ES
Like to read more of my commentaries? Please subscribe my Daily Market Report. Subscribers can find all the members only posts HERE. StockCharts members, please vote for me HERE, thanks.
Like to read more of my commentaries? Please subscribe my Daily Market Report. Subscribers can find all the members only posts HERE. StockCharts members, please vote for me HERE, thanks.
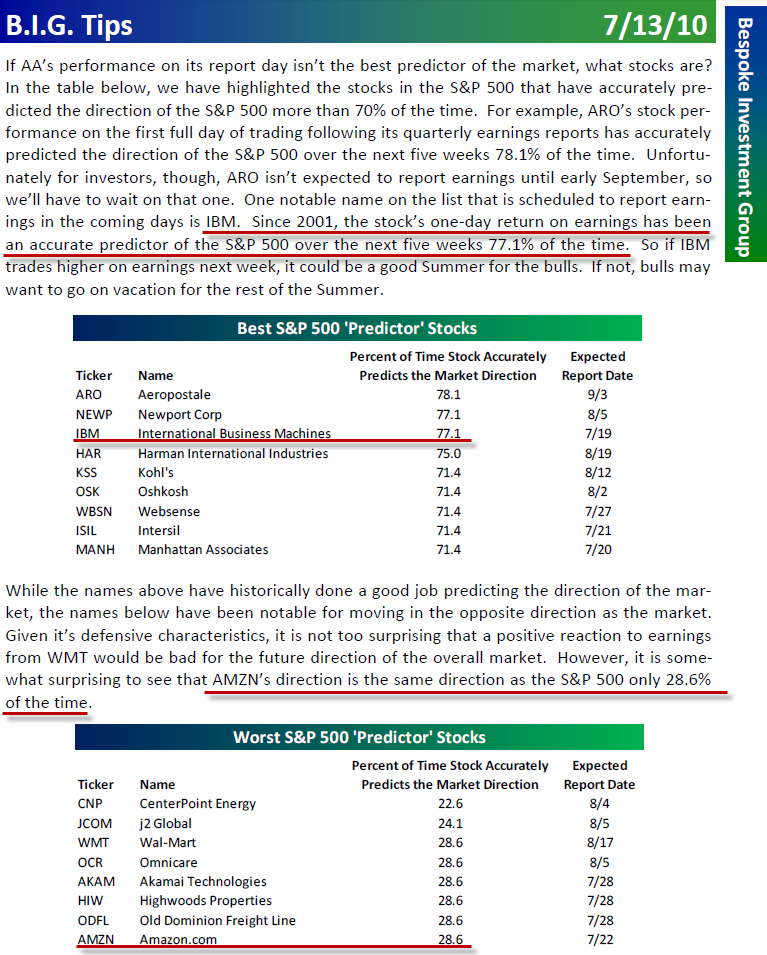
Cobra, there is an scary P bar on IBM today. Their earning report is on next tuesday. Do we need to be worried about market's direction? or AAPL is the new IBM?
TIA


