Back to www.cobrasmarketview.com

06/30/2012 Weekend Update

User avatar
Cobra
Site Admin
Posts: 58855
Joined: Sat Feb 12, 2011 10:29 pm

06/30/2012 Weekend Update

Post by Cobra »

Guess this one day old institutional accumulation distribution chart doesn't matter anymore (courtesy of stocktiming), actually the whole institutional chart idea doesn't help too because it only reflect what is happening now, not the future.
Attachments
2.png

Like to read more of my commentaries? Please subscribe my Daily Market Report.
Subscribers can find all the members only posts HERE.
StockCharts members, please vote for me HERE, thanks.
User avatar
Cobra
Site Admin
Posts: 58855
Joined: Sat Feb 12, 2011 10:29 pm

Re: 06/30/2012 Weekend Update

Post by Cobra »

Smart money still short heavily, we can only know if they've changed the position the next week because of the Friday's super up day. For now the chart still is bearish.
Attachments
SmartMoney.gif

Like to read more of my commentaries? Please subscribe my Daily Market Report.
Subscribers can find all the members only posts HERE.
StockCharts members, please vote for me HERE, thanks.
User avatar
Cobra
Site Admin
Posts: 58855
Joined: Sat Feb 12, 2011 10:29 pm

Re: 06/30/2012 Weekend Update

Post by Cobra »

II and AAII. Retailers are bearish.
Attachments
AAII.gif
II.gif

Like to read more of my commentaries? Please subscribe my Daily Market Report.
Subscribers can find all the members only posts HERE.
StockCharts members, please vote for me HERE, thanks.
User avatar
Richarab
Posts: 617
Joined: Thu Sep 22, 2011 12:19 pm
Contact:

06/30/2012 Weekend Update

Post by Richarab »

Cobra wrote:Smart money still short heavily, we can only know if they've changed the position the next week because of the Friday's super up day. For now the chart still is bearish.

Thanks as always cobra for your work
Tough trading week last week - very temperamental market - and our board kind of reflected that :-)

I felt you (un)moderated well enough and like parent sort of let the kids figure it out for themselves - which I feel we did

Rough seas ahead in the market
But the family is only getting stronger IMHO (in my hummus, onions)

GLTA (which is gay and lesbian tennis association, which I proudly support)


---
I am here: http://tapatalk.com/map.php?zwd0yx
User avatar
KENA
Posts: 2996
Joined: Tue Feb 15, 2011 1:54 pm

Re: 06/30/2012 Weekend Update

Post by KENA »

Cobra wrote:Guess this one day old institutional accumulation distribution chart doesn't matter anymore (courtesy of stocktiming), actually the whole institutional chart idea doesn't help too because it only reflect what is happening now, not the future.
Yes..I agree although not to much can predict the the future.Charts that show what happened yesterday do in some part show a trend of the past that could continue into the near future days.Most everything we see and do are mostly based on past happenings.imho.
User avatar
Cobra
Site Admin
Posts: 58855
Joined: Sat Feb 12, 2011 10:29 pm

Re: 06/30/2012 Weekend Update

Post by Cobra »

Thanks. :mrgreen:

Richarab wrote:
Cobra wrote:Smart money still short heavily, we can only know if they've changed the position the next week because of the Friday's super up day. For now the chart still is bearish.

Thanks as always cobra for your work
Tough trading week last week - very temperamental market - and our board kind of reflected that :-)

I felt you (un)moderated well enough and like parent sort of let the kids figure it out for themselves - which I feel we did

Rough seas ahead in the market
But the family is only getting stronger IMHO (in my hummus, onions)

GLTA (which is gay and lesbian tennis association, which I proudly support)


---
I am here: http://tapatalk.com/map.php?zwd0yx

Like to read more of my commentaries? Please subscribe my Daily Market Report.
Subscribers can find all the members only posts HERE.
StockCharts members, please vote for me HERE, thanks.
User avatar
KENA
Posts: 2996
Joined: Tue Feb 15, 2011 1:54 pm

Re: 06/30/2012 Weekend Update

Post by KENA »

There sure are a lot of articles about Europe.I have read some and most say they have just kicked the can dn the road for a few days or few weeks at the most and it will just get worse and they will end up more in debt.I do belive that but we will just have to wait and see.
User avatar
KENA
Posts: 2996
Joined: Tue Feb 15, 2011 1:54 pm

Re: 06/30/2012 Weekend Update

Post by KENA »

Here is last Mon.Mkt strength chart showing changes in Mkt strength over the past 2+ years.You can see for the past couple of months it has been tending dn and now is slowly turning up.Also note in the past they do not always go stright up.We will get an up date on this chart on Mon the 2nd. (Chart by Stocktiming)
Mountain.png
User avatar
Cobra
Site Admin
Posts: 58855
Joined: Sat Feb 12, 2011 10:29 pm

Re: 06/30/2012 Weekend Update

Post by Cobra »

KENA wrote:There sure are a lot of articles about Europe.I have read some and most say they have just kicked the can dn the road for a few days or few weeks at the most and it will just get worse and they will end up more in debt.I do belive that but we will just have to wait and see.
Policy makers don't care at all about the future, as long as the problem appears solved in the next couple of months or weeks, they're happy.

In the end, printing money is the only solution. All those countries simply keep borrowing and borrowing and borrowing as the best solution is to make the problem worse and worse and eventually, impossible to return the money, then the problem is solved automatically.

Like to read more of my commentaries? Please subscribe my Daily Market Report.
Subscribers can find all the members only posts HERE.
StockCharts members, please vote for me HERE, thanks.
User avatar
KENA
Posts: 2996
Joined: Tue Feb 15, 2011 1:54 pm

Re: 06/30/2012 Weekend Update

Post by KENA »

Hi Cobra..I forget to say thanks a lot of times etc.I know this is a lot of work and does take much time to do a good job as you do and this is much appreciated.While we will have our 4 th july you and your family have a great Canada Days.See you next week.
User avatar
Cobra
Site Admin
Posts: 58855
Joined: Sat Feb 12, 2011 10:29 pm

Re: 06/30/2012 Weekend Update

Post by Cobra »

KENA wrote:Hi Cobra..I forget to say thanks a lot of times etc.I know this is a lot of work and does take much time to do a good job as you do and this is much appreciated.While we will have our 4 th july you and your family have a great Canada Days.See you next week.
Thanks. Happy Independence Day!

Like to read more of my commentaries? Please subscribe my Daily Market Report.
Subscribers can find all the members only posts HERE.
StockCharts members, please vote for me HERE, thanks.
User avatar
Harapa
Posts: 1236
Joined: Mon Oct 24, 2011 1:33 pm

Using ECRI's WLI for ST trading

Post by Harapa »

Here is some information on WLI/WLIG based model that I mentioned yesterday (click on the links in the document to learn more about the model). This model is in sell mode since Jun 1st. Historically, an interim low occurred 20-30 trading days after a basic sell signal, followed by an up move that peaked around day 65, and then came the plunge :lol: .
Please note charts below are copy/reproduction of the original work reported by G. Vrba.
Average Perfromace after Sell Basic
WLIg Exits.png
Individualized Performance of all signals since 1968
Basic sell Performance.png
And this is what happened after day 65. Odd are heavily stacked against any substantial gains.
Basic sell Performance after day 65.png
This time, trading day 20-30 corresponds to June 29-Jul 13.
Caveat: Last year markets started to fall after day 50 (making it the first failure of the system). This also led to revision of the model (by the author) to initiate sell after 7 days of initial signal. Also to note that signals from this models are for long term investment. However, these can be helpful in ST trading.

Combing short term signals generated by VIX (that I have posted in the day trader forum here) or currency SWAP with signals from this model show an interesting pattern. Long trades initiated by the ST setups (VIX or CS) perform substantially better when WLIg based model is in “Buy” mode and short trades do exceptionally well when the model is in “Sell” mode. Table below lists cumulative returns under various combinations.
Performance.png
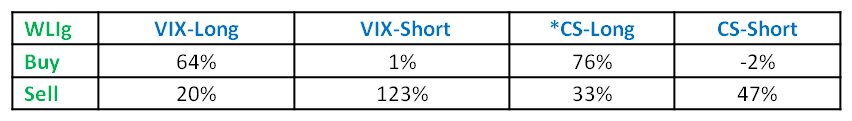
Performance.png (6.12 KiB) Viewed 5378 times
*CS = Currency Swap, based on EURUSD or AUDUSD pairs.
VIX, CS signals derived from hourly data, WLIg signals on daily basis. ST signals last from few hours to few days. Although these setups are for ST trading, the time horizon does get extended in protracted up or down moves (to your benefit).
Periods Analyzed: VIX-May 2007-Present,# of L+S trades=114, B&H Return: -10% (as of close of 6/28/12)
CS - Jan 2009-Present, # of L+S trades=116, B&H Return: 41% (as of close of 6/28/12)

If your find this model interesting and would like to know more about this I will be glad to answer any questions you may have.
Above is provided for informational purposes only and shouldn't be considered an investment advice or recommendation to buy or sell anything.
User avatar
Harapa
Posts: 1236
Joined: Mon Oct 24, 2011 1:33 pm

Improving the performance of Cobra's Non Stop Model

Post by Harapa »

Even Cobra's non stop model is sensitive to the status of WLIg trading model.
NS and WLIG.png
NS and WLIG.png (4.54 KiB) Viewed 5124 times
*NS = Cobra’s nonstop model. Return is sum of trades as listed on the web site. Last trade included in the analysis is long closed on 5/6/2011.
Edit: Additional Data:
Taking both short and long trades results in a cumulative return of 115% but only taking trades inline with WLIg system produces a cumulative return of 202% for the period analyzed.


Comment: This seem to be the case with another long term momentum based model I follow (back testing to 1966).
Return of all long trades since 1966: 26X
Return of all long trades when WLIg is in buy mode: 38X

Since May 2000
Return of all long trades: 67%
Return of all trades when WLIg is in buy mode: 105%
B&H: -1.4%
All returns are for SPX without dividend
Above is provided for informational purposes only and shouldn't be considered an investment advice or recommendation to buy or sell anything.
User avatar
KeiZai
Posts: 2827
Joined: Tue Nov 29, 2011 6:16 pm
Location: EUROPE

Re: 06/30/2012 Weekend Update

Post by KeiZai »

ABC trade idea

Earnings Date: 26-Jul-12
AB1.png
ABC2(st).png
My satisfaction always came from beating the market, solving the puzzle. The money was the reward, but it was not the main reason I loved the market (Jess Livermore)
User avatar
KeiZai
Posts: 2827
Joined: Tue Nov 29, 2011 6:16 pm
Location: EUROPE

Re: 06/30/2012 Weekend Update

Post by KeiZai »

very strong support level for dollar, pullback to at least test that support is very likely (my strong belief is :arrow: will hold)
Dollar.png
Hello P-bar
DXfutures.png
Spent hours with dollar triangle wave puzzle and regardless I am unable to resolve if we are in wave 4 or 3 :roll:
DxLT.png
* Thoughts on dollar are very welcome *
My satisfaction always came from beating the market, solving the puzzle. The money was the reward, but it was not the main reason I loved the market (Jess Livermore)
User avatar
KeiZai
Posts: 2827
Joined: Tue Nov 29, 2011 6:16 pm
Location: EUROPE

Re: 06/30/2012 Weekend Update

Post by KeiZai »

And what I have figured out? Go and figure it out for yourself ;)
DX5.png
My satisfaction always came from beating the market, solving the puzzle. The money was the reward, but it was not the main reason I loved the market (Jess Livermore)
User avatar
silicon_beaver
Posts: 524
Joined: Wed Feb 23, 2011 4:09 pm
Location: Beaverton OR

Re: 06/30/2012 Weekend Update

Post by silicon_beaver »

Cobra wrote:Smart money still short heavily, we can only know if they've changed the position the next week because of the Friday's super up day. For now the chart still is bearish.

banzhang,

Last Friday's vol not very high.
NYSE Volume 4,601,300,500.00
Nasdaq Volume 1,963,165,125.00
total: 6.6 B.

In contrast:
06/22 (Friday one week ago)
NYSE Volume 5,322,476,000.00
Nasdaq Volume... 3,465,574,750.00
total: 8.8 B.
User avatar
xfradnex
Posts: 632
Joined: Fri Sep 09, 2011 12:14 pm

Re: 06/30/2012 Weekend Update

Post by xfradnex »

silicon_beaver wrote:
Cobra wrote:Smart money still short heavily, we can only know if they've changed the position the next week because of the Friday's super up day. For now the chart still is bearish.

banzhang,

Last Friday's vol not very high.
NYSE Volume 4,601,300,500.00
Nasdaq Volume 1,963,165,125.00
total: 6.6 B.

In contrast:
06/22 (Friday one week ago)
NYSE Volume 5,322,476,000.00
Nasdaq Volume... 3,465,574,750.00
total: 8.8 B.
Perfect day to do some evil HFT stuff. :twisted: :evil: :evil: :evil: :cry: :cry:
Flip that coin.

Legal note:Don't believe anything I say above. You may lose yourA$$..
My chart has Daily Elders (Close, High, and Low), MA-2, CCI, and ATR for each stock; all color coded.
User avatar
ZimZeb
Posts: 81
Joined: Wed Dec 28, 2011 3:04 pm
Contact:

Re: 06/30/2012 Weekend Update

Post by ZimZeb »

KeiZai wrote:And what I have figured out? Go and figure it out for yourself ;)
Love the personality in all your charts this weekend KeiZai!

...equally as much as R.a.'s Kuwaiti comedy routines ;P
cac070112apf.png
Image
User avatar
Cobra
Site Admin
Posts: 58855
Joined: Sat Feb 12, 2011 10:29 pm

Re: 06/30/2012 Weekend Update

Post by Cobra »

Sorry, database crashed, should be fixed now.

Like to read more of my commentaries? Please subscribe my Daily Market Report.
Subscribers can find all the members only posts HERE.
StockCharts members, please vote for me HERE, thanks.
Post Reply